
## Recent Developments & Market Context
Notcoin (NOT), the native token from Telegram’s viral “tap-to-earn” game, has caught the attention of traders as speculation builds around a potential 2026 altseason. The token’s got some interesting things going for it—a massive community pulled from Telegram’s roughly 900 million users, deeper ties into the TON ecosystem, and some real utility developments like Visa Card integration and DAO governance proposals. It looks like NOT is slowly evolving from just a fun meme experiment into something with actual use cases.
That said, it’s not all smooth sailing. The token faces challenges typical of this space—inconsistent volume, stubborn resistance levels near recent highs, and the question of whether adoption can really scale beyond Telegram social circles.
Price-wise, NOT has been hanging around the $0.00060 mark during recent consolidation periods. This level has held up even when the broader market got wobbly, which suggests we might be looking at a solid base that could launch the next leg up—assuming resistance doesn’t prove too tough to crack.
—
## Current Technical Picture
Let’s dig into what the charts and indicators are telling us about where NOT/USDT might be headed in the short and medium term.
### Moving Averages & Pivot Points
On the 4-hour timeframe:
• The Simple Moving Average sits around 0.0006085, with the Exponential Moving Average at about 0.0006079. Current price (roughly 0.0006320) is sitting comfortably above both, which points to some recent upward momentum building.
• Looking at daily pivot points, we’ve got the main pivot at about 0.00063233. Support levels stack up below at S1: 0.0006227, S2: 0.00060833, and S3: 0.00059867. Resistance waits above at R1: 0.00064667, R2: 0.00065633, and R3: 0.00067067. With price just above the pivot right now, that zone between the pivot and R1 is where the action is.
### Oscillators: RSI and MACD
The 4-hour Relative Strength Index is reading about 61.57. That’s showing a bullish tilt without being overheated yet, which means there’s still headroom for more upside if the momentum continues.
On the MACD (4h): The MACD line is sitting slightly under the signal line, giving us a small negative histogram (around –0.00000303). This tells us short-term momentum is a bit mixed right now, and we might see some cooling off unless we get a positive crossover soon.
—
## Price Prediction: Scenarios & Key Levels
With indicators showing a cautiously optimistic picture, here’s how things could play out for NOT/USDT.
### Bullish Scenario
If buyers manage to break through resistance at R1 (about $0.0006467) and keep price above that daily pivot (around $0.0006323), NOT could make a run toward the mid-resistance zone between $0.0006563 and $0.0006707 (that’s R2 to R3). If momentum indicators cooperate—think RSI climbing toward 70 and MACD histogram flipping positive—we could see a push toward $0.00070 or even higher in the near term. This scenario gets more likely if altcoins catch a bid overall and those TON integrations or utility rollouts get good reception. In this case, those 4h moving averages would likely act as support on any pullbacks.
### Bearish Scenario
If NOT can’t hold above that pivot (around $0.000632) and breaks below, we’re probably looking at a slide toward S1 (about $0.0006227). Lose that, and the next catch points are S2 (roughly $0.0006083) and S3 (around $0.0005987). Sustained negative momentum on MACD, falling RSI, or broader market weakness—like Bitcoin dominance rising and sucking liquidity out of alts—could send us down to those lower support zones. Keep an eye on candlestick patterns and volume spikes that might signal a breakdown is coming.
—
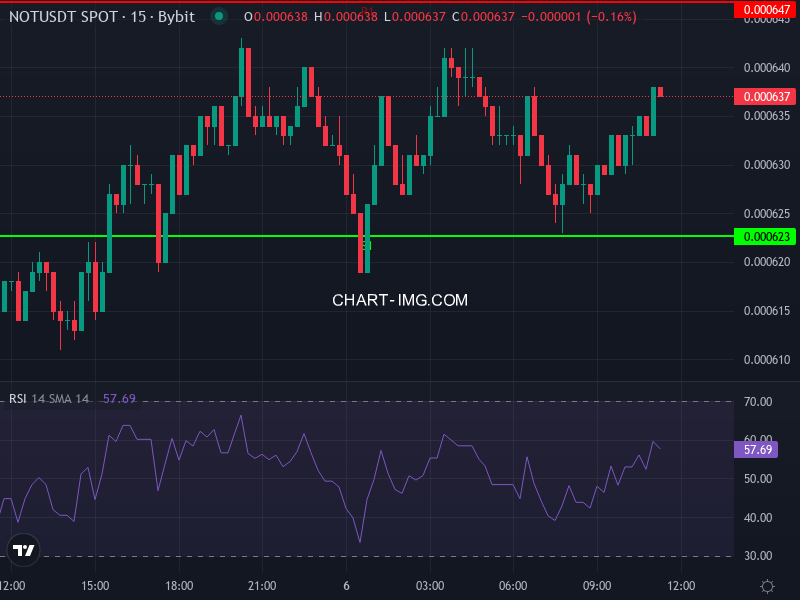
## Visual Chart
The image below captures the recent price action, including those support and resistance zones, moving averages, and pivot points we’ve been discussing:
—
## Strategic Considerations for Investors
For short-term traders looking to enter long positions, consider keeping a tight stop loss just under that daily pivot (around $0.0006323) if you’re playing a breakout above R1. You’ll want to see some confirmation—maybe a MACD crossover or RSI pushing past 70—before getting too aggressive. If you’re thinking longer term, the real drivers are going to be progress on actual utility (that Visa card integration, DAO governance) and whether people actually use this thing beyond just tapping their phones in the game.
Even if price action stalls at current resistance, weak fundamental execution could cap the upside. On the flip side, strong execution could be the catalyst that breaks things higher.
Keep risk management front and center here—volatility is still running high, and those indicators are giving mixed signals. A drop below S2 (around $0.0006083) opens up more downside risk. But a clean break above R2 (about $0.0006563) could flip the risk-reward picture decidedly bullish. Pay attention to overall market vibes, what Bitcoin’s doing, and any news from the TON ecosystem—any of those could be the spark NOT needs to realize that bullish potential.