Current Market Overview & News Snapshot
Shiba Inu has been going through a rough patch lately, dropping all the way down to $0.00000666—a price level we haven’t seen since the middle of 2023. This happened during a pretty chaotic period for the entire crypto market. While the token has bounced back a little bit and is now hovering around $0.00000681, investors are still feeling nervous. There’s been a lot of whale activity with big holders heading for the exits, plus some worrying signs around the ecosystem itself. On one hand, over 207 billion SHIB tokens left exchanges, which usually means people are holding for the long haul. But on the other hand, Binance unlocked a massive cold wallet containing 1 trillion SHIB, and if those tokens hit the market, we could see some serious selling pressure.
From a technical standpoint, things are pretty mixed right now. Analysts are seeing oversold conditions on the RSI indicator, but the MACD is showing bearish signals. There are some support zones that seem to be holding up so far. Some folks think SHIB could rally back up to around $0.0000085 if it manages to break through key resistance levels, while others are warning that we might revisit those recent lows if the overall market stays weak.
Technical Indicators: Interpreting SMAs, EMAs, MACD, RSI & Pivots
Right now, SHIB is trading at roughly 0.0000067894 USDT, which is down about -0.53% in the last 24 hours. Looking at the 4-hour chart, the RSI is sitting at around 45.13, putting it in neutral to slightly bearish territory—not quite oversold yet. The MACD is sitting just below its signal line with a negative histogram, which typically means we can expect more bearish price action unless something changes quickly.
The 4-hour Simple Moving Average is at about 0.0000068960, and the Exponential Moving Average is slightly higher at 0.0000069474. Since the price is trading below both of these, there’s an increased risk of more downside unless we get some kind of strong positive catalyst. For daily pivot points, we’re looking at resistance levels around R1: ~0.00000687, R2: ~0.00000694, and R3: ~0.00000704. On the support side, we’ve got S1: ~0.00000670, S2: ~0.00000660, and S3: ~0.00000653. The price action right now seems to be stuck between S1 and R1, which tells us we’re in a pretty tight consolidation phase.
Price Graphic & Key Chart Observations
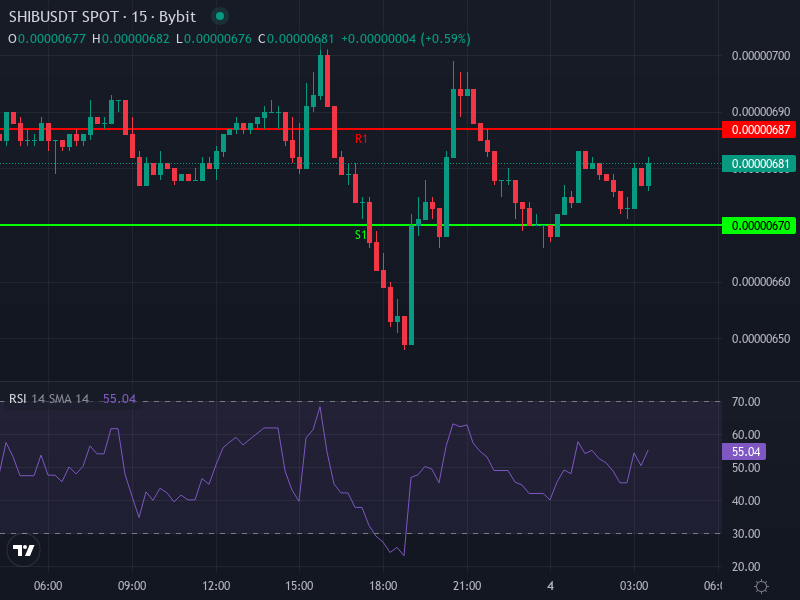
When you look at the charts, you can see a falling wedge pattern developing over several trading sessions. Basically, the price swings are getting narrower and narrower. This type of pattern often signals a reversal is coming—but only if the price can break above the upper line of the wedge. Another interesting thing is that volume has been dropping during these pullbacks, which usually means selling pressure is getting weaker as we approach or bounce off that $0.00000660–$0.00000680 demand zone. The MACD histogram is pretty flat or just slightly negative, which fits with this sideways to mildly bearish vibe we’re seeing. Those daily pivot levels I mentioned earlier are really useful markers for figuring out where breakouts might happen or where the downside risks are.
Support & Resistance Levels
• Immediate resistance: ~0.00000687–0.00000694 (pivot R1–R2)
• Strong resistance zone: ~0.00000704 (R3)
• Support near: ~0.00000670 (S1)
• Critical support if breached: ~0.00000660 and ~0.00000653 (S2–S3)
Price Prediction: Scenarios & Projections
Taking everything into account—the technical indicators, market signals, and overall sentiment—I see two main scenarios playing out in the short term (next 1–3 weeks), plus a longer-term outlook for the next 3-6 months.
Scenario A: Moderate Rebound (~+20-30%)
If SHIB manages to stay above that $0.00000670 support level and starts building upward momentum—you’ll know this is happening when the RSI climbs above 50 and the MACD crosses into bullish territory on the 4-hour or daily charts—then we could see a push up to the resistance around $0.00000694. If it breaks through $0.00000704, things could get interesting with a potential move toward ~$0.00000850, especially if the broader market sentiment turns positive. For this to work out, we’d need to see whales continuing to accumulate, fewer tokens flowing out of exchanges, and no major negative news that kills the risk-on mood.
Scenario B: Continued Decline / Sideways Grind
On the flip side, if SHIB can’t break above those moving averages and the MACD stays below its signal line with flat or dropping volume, we’re probably looking at a drift lower toward the $0.00000660–$0.00000653 zone. If it breaks below $0.00000653, that could open the door to revisiting those 2023 lows or even trigger a faster drop. This scenario becomes more likely if we stay in a risk-off environment or if large holders decide to start dumping their bags.
Long-Term Outlook (3-6 Months)
Looking further ahead, if the Shiba Inu ecosystem keeps developing—think Shibarium upgrades, real-world use cases like those payment cards people have been talking about, increased burn rates, and strong community support—and if the overall crypto market gets healthier, SHIB could realistically target higher resistance zones around $0.00000850–$0.00000950. Now, getting back to $0.00001 or higher is a bigger ask. That would require several bullish signals to line up perfectly (like weekly candles closing above major resistance levels, clear trend reversals) plus continued whale accumulation. Without those catalysts materializing, SHIB will probably just bounce around between $0.00000650 and $0.00000800 for quite a while.