Dogecoin is currently changing hands around $0.1217, down about 4.2% over the past 24 hours. Looking at the 4-hour chart, the RSI sits at roughly 31.3, which puts it close to oversold territory. This suggests the selling pressure might be losing steam in the near term. Both the Simple Moving Average at around $0.12865 and the Exponential Moving Average near $0.12753 are trading well above the current price—a clear sign that DOGE is still fighting an uphill battle. The MACD tells a similar story, sitting below its signal line with a negative histogram that confirms the bearish momentum hasn’t let up yet.
When we look at the daily pivot levels, resistance sits in layers between roughly $0.126 and $0.1327, while support zones can be found around $0.1190, $0.1164, and $0.1121. The one-day rate of change shows a drop of about 7.7%, highlighting just how volatile things have gotten on the downside.
As we head deeper into December 2025, the broader crypto market has been taking hits. Bitcoin and Ethereum have both pulled back as U.S. Treasury yields climb and ETF money flows have dried up—and that weakness has naturally spilled over into altcoins like Dogecoin. The institutional buying that helped prop up prices earlier in the year has cooled off considerably. Recent reports show large holders have been offloading positions, which has only made the technical breakdown at key resistance levels worse.
Technical Indicators: Key Levels, Momentum, and Price Structure
Short-Term Indicators
With the 4-hour RSI hovering around 30, DOGE is dancing near what most traders consider oversold. If the current support manages to hold and sellers start backing off, we might see a short-term bounce. That said, the moving averages are sitting overhead like a ceiling—both the SMA around $0.1286 and EMA near $0.1275 are well above where we’re trading now. Any rally attempt will need to push through these barriers to flip the short-term momentum. The bearish MACD setup just adds more weight to the case that sellers are still in control for now.
Daily Support & Resistance Zones
Looking at the daily pivot points, the first hurdle to clear is around $0.1259, with tougher resistance waiting between $0.1301 and $0.1327. On the flip side, immediate support levels are clustered between $0.1189 and $0.1164, with a deeper safety net near $0.1121. Since DOGE has already sliced through some key support areas and hasn’t been able to reclaim resistance, these levels become critical reference points—either as potential bounce zones or warning signs if they break down further.
Momentum & Pattern Dynamics
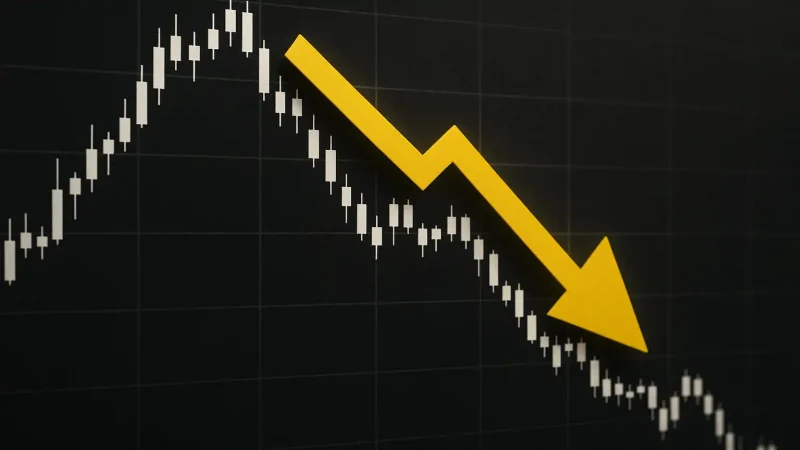
Recently, DOGE has been printing lower lows, which is textbook bearish continuation. When you combine that with heavier volume on down days—especially selling from whale addresses—it’s clear that supply is overwhelming demand. Until we start seeing higher lows form and a convincing break above the $0.127 to $0.130 zone, the path of least resistance remains to the downside.
Forecast: Price Paths Based on Technical Scenarios
Given where things stand—oversold readings mixed with downward momentum and clearly marked support and resistance—here are the most likely scenarios playing out:
1. Bearish continuation: If DOGE can’t hold above $0.1189 and slips under $0.1164, we’re likely looking at a move toward $0.11 or even $0.105. These line up with the deeper support levels and could get extended if broader market sentiment stays sour or macro conditions worsen.
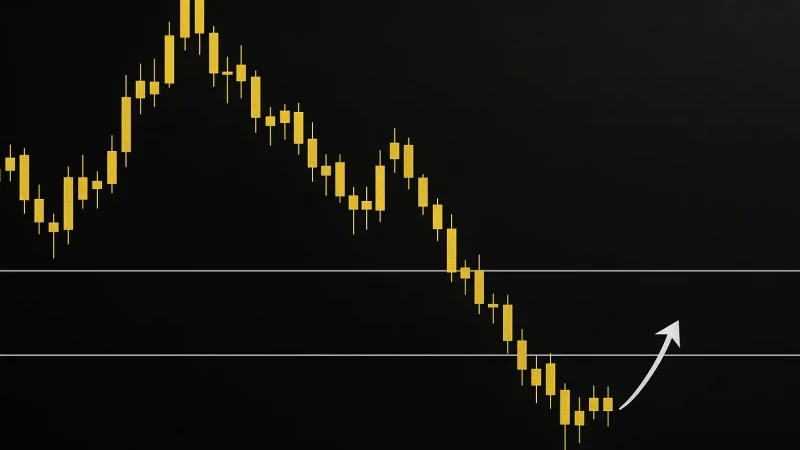
2. Short-term relief rally: A bounce from here could take us back to resistance around $0.1275 to $0.130, especially if the RSI climbs back above 40 and the MACD starts to converge. We’d want to see closes above both the SMA and EMA on the 4-hour chart to confirm any real strength returning.
3. Neutral consolidation: DOGE might just chop around in a range between roughly $0.1185 and $0.1300, building a base before making its next big move. Watching how volume behaves during bounces versus pullbacks will give us clues about which way it eventually breaks.
Strategic Implications for Traders and Investors
If you’re trading short-term, tight stops are your friend here. Anyone taking long positions should consider placing stops below $0.1164, since losing that support would be a pretty bad sign. If a bounce does materialize, targeting that $0.1275 to $0.130 resistance zone offers decent risk-reward. For those thinking about building positions, you’ll want to see clearer signs of reversal first—things like the MACD flipping positive or price reclaiming those moving averages on the shorter timeframes.
For longer-term investors, patience is the name of the game. The bigger picture won’t improve until we see some positive shifts in the macro environment—think stabilizing or falling Treasury yields, institutions coming back to the table with fresh capital, or meaningful catalysts like regulatory clarity or real-world adoption in payments and DeFi. Until those pieces fall into place, there’s a real possibility we test even lower levels first.