Recent Developments & Market Sentiment Aligning with Indicators
WHITEWHALE has been on quite a rollercoaster over the past few months, experiencing dramatic price swings that have left many traders holding their breath. Back in early 2026, the coin’s market cap shot up past $200 million before pulling back to settle around $160–170 million. During this rally, we saw massive community excitement, fresh liquidity pouring in, and some serious whale accumulation—most notably when one savvy wallet holder turned roughly $68,000 into a staggering $4.48 million in just 27 days.
But the story isn’t all sunshine and gains. The momentum has proven fragile, with several gut-wrenching crashes along the way. One particularly brutal event saw an early holder dump $1.3 million worth of tokens, triggering a 45–60% collapse in a matter of hours. These sharp drops were made worse by thin liquidity and widespread panic selling among smaller holders.
Right now, WHITEWHALE is trading somewhere between $0.07 and $0.11, depending on which exchange you’re looking at. Like many Solana-based memecoins, it’s heavily influenced by overall market sentiment—when traders are feeling adventurous, momentum picks up; when whales cash out or the hype dies down, prices can tank just as quickly.
Technical Indicators: Key Levels, Oscillators & Moving Averages
Let’s dig into what the charts are actually telling us right now:
Support and Resistance Levels
– The immediate support zone sits around $0.077–$0.083, where we’ve seen the price bounce multiple times recently during pullbacks.
– If that level gives way, there’s another stronger support cushion down near $0.063 that could catch any further decline.
– On the upside, resistance is clustered between $0.12–$0.15, with more optimistic breakout targets pointing toward $0.20–$0.25 if the bulls really get going.
Oscillators & Trend Indicators
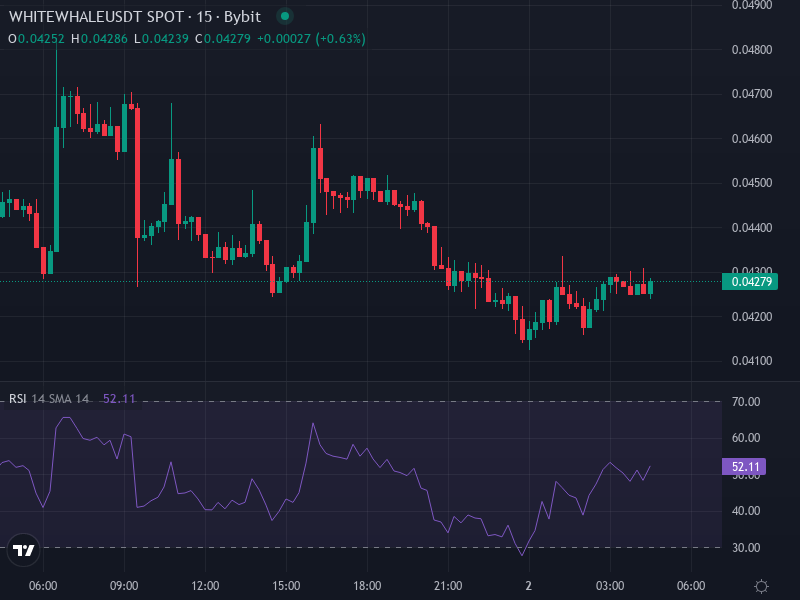
– The 14-day Relative Strength Index (RSI) has dropped deep into oversold territory, sitting well below the neutral 50 mark. This suggests the recent selloff may have been overdone from a momentum perspective.
– Both the Stochastic RSI and the 14-period fast stochastic are flashing buy signals as they hover near their lower boundaries.
– The Average Directional Index (ADX) remains elevated, which tells us there’s still a strong trend in play—though at the moment, that trend is pointing downward.
Moving Averages & Long‐Term Trend Analysis
– Price is currently trading well below both the 50-day and 200-day moving averages, painting a bearish picture for the longer-term trend.
– We haven’t seen any bullish moving average crossover yet. For a genuine reversal, traders will want to see price climb back above the 50-day MA and hold there.
– Volatility remains sky-high, with wild daily swings and unpredictable volume spikes—which means both risks and potential rewards are amplified.
Price Forecast Scenarios Based on Indicator Confluence
Based on everything we’re seeing, here are the most likely paths forward:
Bearish Scenario: Breakdowns & Capitulation
If the $0.077–$0.083 support zone breaks down convincingly, we could see WHITEWHALE test $0.063 next, with $0.045 as a deeper fallback level—especially if volume continues to dry up and more whales decide to exit. In this scenario, the RSI would likely remain stuck in oversold territory, the ADX might spike briefly before rolling over, and price would continue grinding lower beneath the moving averages.
Bullish Scenario: Recovery Breakout
For the bulls to take control, WHITEWHALE needs to punch through the $0.12–$0.15 resistance zone on strong volume. A clean breakout above that level—combined with RSI climbing back above 50 and price reclaiming the 50-day moving average—could open the door to $0.20, with an outside shot at $0.25 if memecoin mania kicks back into gear. This kind of recovery would probably need some positive catalyst, whether that’s renewed community hype, partnership announcements, or broader market strength.
Neutral/Mixed Outcome
There’s also a good chance WHITEWHALE just chops around between $0.08 and $0.12 for a while, building a base. During this consolidation phase, oscillators would cycle from oversold back toward neutral levels. Chart watchers should look for reversal candles like hammers near support and rejection wicks at resistance. The upside is limited here, but so is the downside—until something breaks one way or the other.
Strategic Implications for Traders
If you’re thinking about trading this, risk management isn’t optional—it’s absolutely critical. Given the history of sudden whale dumps and liquidity crunches, position sizing should be conservative. Anyone going long should place stop losses just below the major support levels around $0.075–$0.08. On the flip side, consider taking some profits off the table near $0.12–$0.15, and again if price approaches $0.20.
From a technical standpoint, keep your eyes peeled for RSI divergences where price makes new lows but RSI doesn’t follow, MACD crossovers on the daily chart, and how price reacts when it tests those moving averages. Volume is your friend here—big volume on rallies suggests real strength, while low-volume breakouts are often bull traps waiting to snap shut.
Current Price Visuals
Natural Insight: Timing and Edge
WHITEWHALE perfectly captures the memecoin paradox—enormous upside potential under the right circumstances, but serious downside risk most of the time. Right now, the best opportunities probably lie in carefully timing entries during oversold conditions after major dumps, when fundamentals and sentiment might be aligning for a bounce. But holding through resistance levels without taking profits is playing with fire.
Success with this coin requires more than just reading indicators. You need to monitor whale wallet movements, track exchange liquidity, and keep your finger on the pulse of community sentiment. Honestly, knowing when to stay out or when to exit a position is probably more important than picking the perfect entry price. This isn’t a buy-and-hold asset—it’s a trade that demands active management and discipline.