Recent Developments and Context
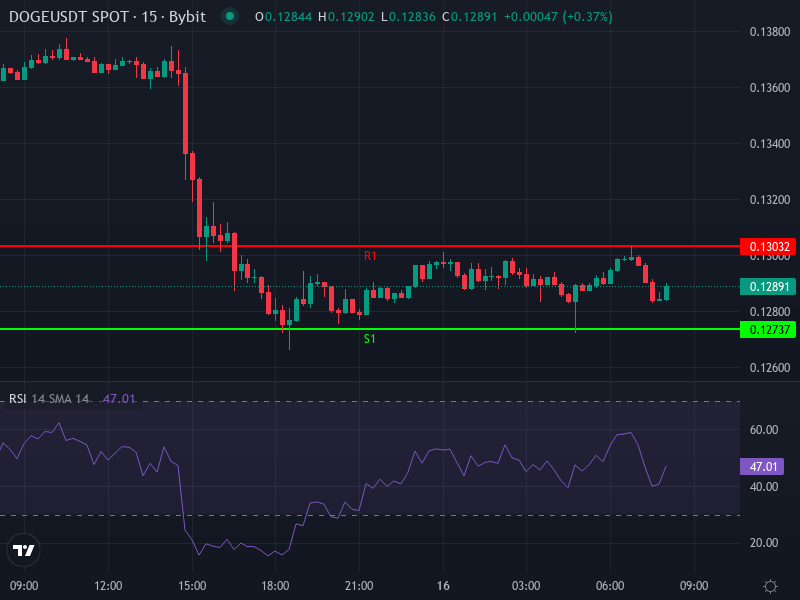
Right now, DOGE/USDT is trading around $0.1288, which marks a pretty sharp 24-hour drop of about −5.63%. Looking at the 4-hour chart, the technical indicators are painting a fairly grim picture: DOGE has fallen into oversold territory with the Relative Strength Index (RSI) sitting at around 30.7. The MACD line is hanging below its signal line with a slightly negative histogram, which isn’t exactly encouraging. Both the Simple Moving Average (SMA) and Exponential Moving Average (EMA) are hovering between $0.1354 and $0.1361, creating what’s basically a wall of resistance just above where we’re trading now.
When you look at broader technical signals from various analysis platforms, they’re all telling the same story: things look weak. Multiple moving averages—the 10-day, 50-day, and longer ones—are all flashing sell signals. The MACD histogram is in negative territory, and other indicators like the Average Directional Index (ADX), Commodity Channel Index (CCI), and Williams %R are all showing strong bearish momentum. We’re definitely in a risky phase where any attempts to push higher are likely going to struggle. Social sentiment around DOGE has been pretty lackluster too, and the coin continues to move in sync with the broader altcoin market during this period of weakness.
On a more positive note, there have been some interesting regulatory developments that could help in the longer run: U.S. regulators recently gave the green light to the first Dogecoin-backed ETF. This signals a more welcoming environment for crypto investment products and could potentially bring in institutional money if the ETF becomes a popular vehicle for larger investors. That said, DOGE’s inflationary supply dynamics—the fact that there’s no cap on how many tokens can be created—continues to be a concern for people thinking about holding long-term.
Analysis of Technical Indicators & Key Levels
Let’s dig into the momentum metrics a bit: DOGE’s 4-hour RSI around 30 tells us we’re in oversold territory, which often means we’re due for at least a short-term bounce. But here’s the catch—the MACD is still negative with its histogram sitting just below zero. This suggests we’ve got weak downward pressure rather than strong reversal signals brewing. The SMA and EMA cluster sitting just above current price (around $0.135–$0.136) is acting as immediate resistance, so any move upward needs to break through that zone to be taken seriously. Looking at daily pivot points, DOGE is trading near its pivot point (~$0.12878), with resistance levels at R1: ~$0.1303, R2: ~$0.1317, R3: ~$0.1333, and support levels below at S1: ~$0.12737, S2: ~$0.12583, S3: ~$0.12442.
When it comes to chart patterns, there are actually some potentially bullish formations taking shape: we’re seeing what looks like an inverse head-and-shoulders pattern, and possibly a falling-wedge or triangular consolidation. If these patterns play out with a breakout, we could see DOGE push toward the ~$0.16–$0.18 range, with further upside potential toward $0.20–$0.23 if buyers can keep control and sentiment improves. On the downside, if DOGE can’t hold support around $0.12–$0.13, we could be looking at deeper corrections toward the $0.10–$0.11 zone if the market really turns sour. It’s worth noting that these support zones line up with previous demand areas and lower-day moving averages, which makes them more significant.
Short-Term vs Mid-Term Scenarios
Short-Term Bear Case: If DOGE fails to break back above that ~$0.135–$0.136 resistance cluster, we’re probably going to see the downtrend continue. If the pivot support gives way, the next logical targets are $0.1258 (daily S2) and then $0.1244 (S3). The RSI could push even deeper into oversold territory, which might slow the decline but also signals that bearish sentiment is really taking hold.
Short-Term Bull Case: If DOGE manages to push through that resistance zone at ~$0.135–$0.136, we could see a quick move toward $0.145–$0.15. A clean breakout from the falling wedge or inverse head-and-shoulders on shorter timeframes could send price even higher toward $0.16–$0.17, especially since those levels have acted as supply zones during past rally attempts.
Mid-Term Outlook: Looking out over the next few weeks to months, the bigger picture patterns suggest that if ETF money starts flowing in and overall market risk sentiment improves—maybe from Bitcoin stabilizing or positive macro news—DOGE could test the $0.20–$0.23 range. Push beyond that, and $0.25–$0.30 becomes realistic, but only if we see volume pick up and those support zones hold. Of course, the unlimited token supply issue and potential negative regulatory or economic surprises remain risks that could either cap gains or trigger bigger selloffs.
Strategic Implications for Traders and Investors
If you’re a short-term trader, DOGE is offering some interesting bounce setups right now given how oversold it is. Taking opportunistic long positions near $0.125–$0.13 with tight stop-losses could work well, targeting those resistance zones just above $0.135. You’ll want to wait for momentum confirmation though—like the MACD histogram crossing back into positive territory or a break above the 4-hour EMA—before committing. On the flip side, if DOGE breaks below support at $0.1258, short positions or hedges might make sense as we could see further downside toward $0.11–$0.12.
For long-term investors, it’s better to tune out the daily noise and focus on the bigger catalysts—things like regulatory clarity around the ETF, how the inflation rate plays out, whether institutions actually start buying, and any real utility developments. If the medium-term bullish scenario unfolds, there’s a decent opportunity to accumulate over several months with price targets in the ~$0.20–$0.30 range. Just be smart about it: expect counter-trend corrections, size your positions appropriately, and manage risk through diversification.
Final Insight: DOGE is really at a critical juncture here. In the near term, bearish pressure is definitely in control unless we can get above that mid-$0.13 resistance. But there are some promising signs—potential pattern breakouts, oversold indicators, and growing institutional interest—that suggest upside could be very real if momentum shifts in favor of the bulls. For now, traders should treat any gains as conditional and not get ahead of themselves. Investors should keep a close eye on regulatory developments and market sentiment before adding significantly to positions.