Recent Price Action & Fundamental Sentiment
Toshi is currently trading at around $0.00019241, down roughly 1.86% over the past 24 hours. The price is sitting well below recent resistance levels and trading under several key moving averages that had been established during earlier rallies. Market sentiment is pretty mixed right now—the initial meme-coin hype has cooled off, but there’s still a dedicated community of holders who remain optimistic about the project’s long-term prospects, particularly given recent development updates and growing community engagement.
What’s interesting is that Toshi has been working to become more than just another meme coin. The team has been rolling out actual utility tools for developers, moving toward DAO governance through something called “Meow DAO,” and building out ecosystem features like the Toshi Mart launchpad. These developments could potentially drive real demand beyond just speculative trading. It’s also worth noting that exchange listings—particularly on South Korea’s Upbit and Coinbase—have historically created significant price movements and trading volume for TOSHI.
Key Technical Indicators & Trend Zones
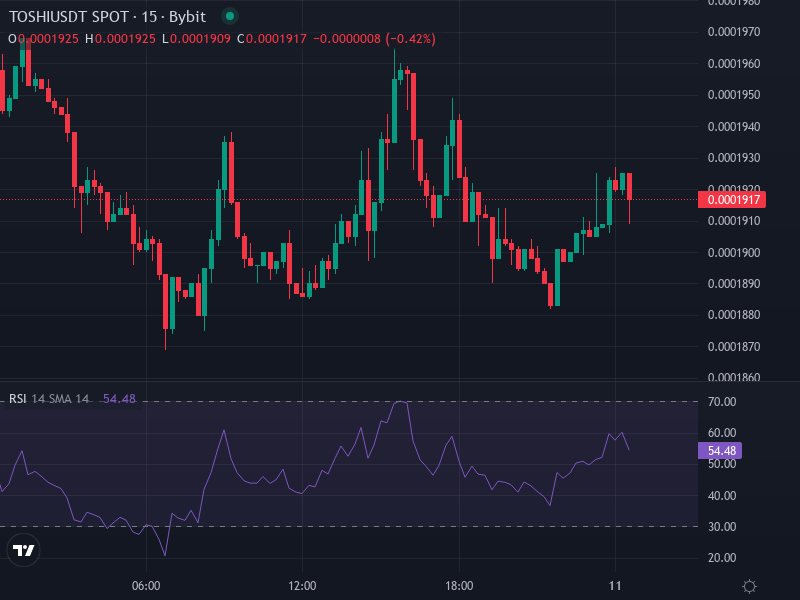
Looking at the technicals, things are ranging from neutral to clearly bearish. The 14-day RSI is hovering around 40.85, which is fairly neutral territory. The daily MACD is showing flat to slightly negative readings, which tells us there isn’t much bullish momentum building right now. The ADX is sitting at about 27-29, indicating a moderate trend that’s currently pointing downward. Meanwhile, the CCI indicator is deeply negative, suggesting oversold conditions—which could potentially set up a bounce if buyers step in.
The moving averages aren’t painting a pretty picture either. The EMA-20, EMA-50, and SMA-50 are all above the current price, acting as overhead resistance. The SMA-100 is a bit closer but still above where we’re trading now. Resistance is clustered around $0.00035–$0.00060, while support looks weak between $0.00030–$0.00020. Stronger support doesn’t really appear until we get down to $0.00015 or lower—though that level hasn’t been tested recently. Fibonacci retracement levels show major resistance zones up in the $0.0005–$0.0011 range.
Short-Term vs Medium-Term Price Paths
In the short term, if selling pressure lets up and the RSI bounces from oversold levels, we could see a move back toward $0.00025–$0.00040. Breaking above that range could clear the EMA-50 and potentially open the door to a run toward $0.00060. That would require significant volume and maybe some positive news like another exchange listing or a major utility announcement.
If we can’t break through resistance, the price could drift sideways or continue lower, potentially testing support around $0.00010–$0.00020. This downside risk becomes more real if broader crypto market sentiment turns negative or if speculative money rotates into larger, safer coins.
Price Prediction Scenarios
Looking at the current technical setup and fundamentals, here are two likely scenarios:
- Bullish Scenario (Probability ~30-40%): After consolidating around current levels, TOSHI breaks through resistance at around $0.00035. Momentum builds and pushes the price toward $0.00060-$0.00070 over the next few weeks. Key catalysts would be a new exchange listing, successful rollout of ecosystem tools, or a broader market shift toward higher-risk altcoins.
- Bearish Scenario (Probability ~60-70%): Price fails to reclaim resistance and drops below support near $0.00015, continuing the downtrend. In this case, we could see targets around $0.00010 or lower—potentially washing out oversold conditions before any meaningful rebound.
What To Watch
If you’re tracking Toshi, here are the key things to keep an eye on:
- Volume spikes or large wallet accumulation that could signal an upcoming breakout. Historically, whale movements have provided early warnings before major price action in TOSHI.
- New utility launches like developer tools or mobile services that shift the narrative from pure speculation to actual use cases. These types of developments can drive demand from holders beyond just the meme community.
- Exchange listings, especially in markets with strong retail crypto participation. Listings tend to boost visibility, liquidity, and often drive new highs. The Upbit listing was a perfect example of this dynamic.
- Broader market conditions—overall crypto sentiment, regulatory news, and whether capital is flowing into altcoins or retreating to stablecoins and Bitcoin.
Final Insight
With TOSHI currently at $0.00019241 and trading well below recent support and resistance levels, the near-term trend is leaning bearish. Unless we get a strong catalyst, the downside risk seems greater than the upside right now. That said, oversold indicators suggest a relief rally is possible—though it would likely be limited and would need strong volume or positive news to sustain it. For any meaningful gains from here, TOSHI will need to decisively break through resistance zones and prove that its utility developments are translating into real demand.