Recent Market & News Context
Pepe Coin (PEPE) keeps pulling attention in the meme-coin world, helped along by whales buying up larger positions and the community getting excited again. Sure, the broader economy isn’t doing us any favors, but analysts are saying PEPE’s vibe has actually gotten better compared to early 2025. On-chain data shows more coins moving off exchanges and people buying at important support levels. That said, let’s be real—this thing is still super volatile, and fake breakouts happen all the time with these speculative coins.
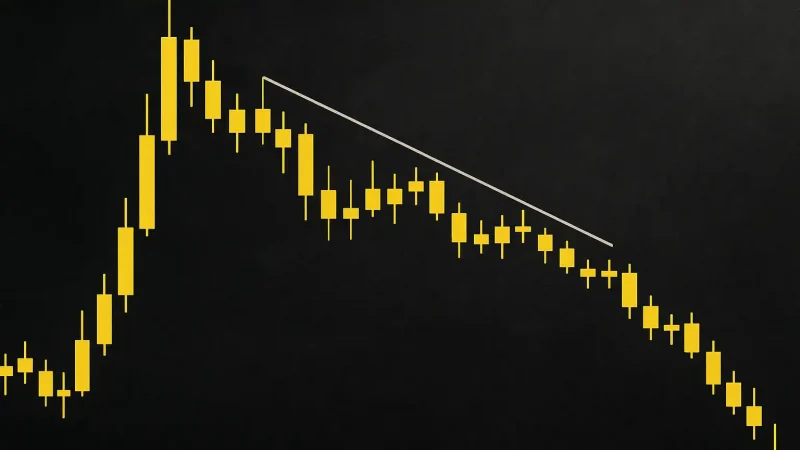
Chart watchers are talking about a potential inverted head-and-shoulders pattern forming, plus PEPE recently broke above a downtrend line that had been holding it down for weeks. Now everyone’s waiting to see if it can actually stay above these resistance levels to confirm this might be the real deal. One thing to keep in mind: PEPE is still very much at the mercy of Bitcoin’s moves and overall market risk appetite, which could throw a wrench in any forecasts.
Technical Indicators & Price Prediction
Right now, PEPE is sitting at $0.00000423119540 USDT. In the last day, it’s moved about +0.00060579 USDT—nothing crazy, but there’s some action. Here’s what the 4-hour charts are telling us:
- RSI (4h): Around 46.30 – pretty neutral, maybe leaning slightly weak. It’s not screaming overbought or oversold right now.
- MACD (4h): Both MACD and signal lines are negative, though there’s a tiny positive histogram reading (about +2.53×10⁻⁸) hinting at early bullish divergence. Don’t get too excited though—momentum is still pretty weak, and the MACD line hasn’t crossed above the signal yet.
- Moving Averages: The 4-hour EMA (around $0.00000433080) is sitting above current price, acting as overhead resistance. Same story with the 4-hour SMA (approximately $0.00000428333). When price is below both of these, it usually means the short-term trend is still struggling.
Key Support and Resistance Levels
Looking at daily pivot points, here’s what matters:
- Resistance levels (daily R1-R3): roughly $0.00000431999 (R1), $0.00000440000 (R2), $0.00000451000 (R3)
- Support levels (daily S1-S3): around $0.00000413000 (S1), $0.00000402000 (S2), $0.00000394000 (S3)
- Daily pivot: $0.00000420999 – this is basically the short-term battleground for where price wants to go.
Predicted Price Scenarios
Looking at the patterns and momentum together, here are a few ways this could play out:
- Bullish scenario (if PEPE gets back above those EMAs and SMAs, volume picks up, and we see closes above $0.00000500): We could be looking at moves toward around $0.00000592, with more resistance somewhere near $0.00000663. If the meme coin market really heats up, we might even see $0.00000700–$0.00000800. That’s potentially 2-3x from here, which sounds great but requires a lot to go right.
- Base-case consolidation: More likely, price just bounces around between the pivot (about $0.00000421) and resistance (around $0.00000500), with support holding at $0.00000420 down to $0.00000400. Whether it breaks out or just chops sideways really depends on volume and whether people stay interested.
- Bearish risk: If it can’t hold that daily pivot and drops below $0.00000402–$0.00000394, things could get ugly fast—maybe down to $0.00000350 or worse. Since we’re already trading below both short-term moving averages, the downside risk is real, especially if Bitcoin gets hammered or sellers take control.
The real make-or-break zone is between $0.00000500–$0.00000550. If PEPE punches through that with real conviction and volume, sentiment could flip bullish in a hurry. Until that happens though, anyone going long should be careful, use tight stop-losses, and keep an eye on volume.
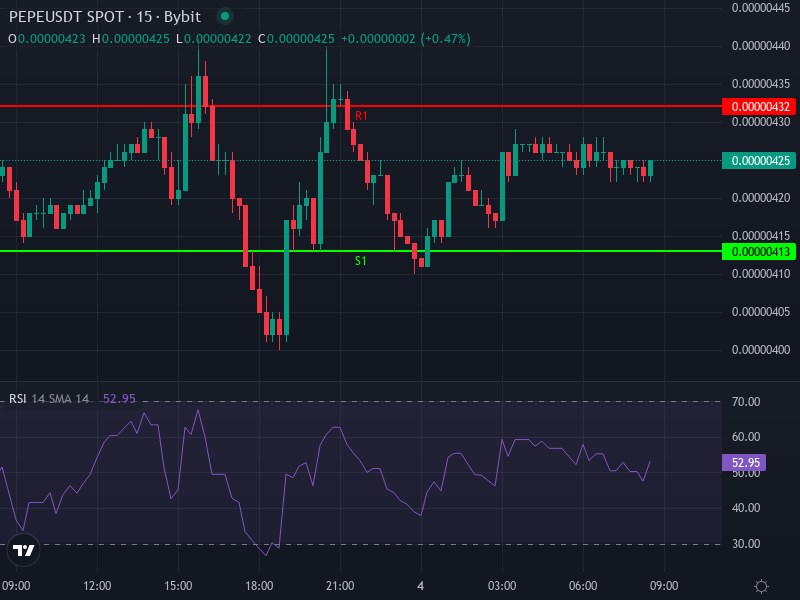
Visual Technical Representation
Here’s the latest advanced trading chart for PEPE/USDT, showing trend lines, support and resistance zones, and moving averages:
Final Insight: Strategic Trade Zones
If you’re thinking about trading PEPE, look for entry points around those support levels between $0.00000400–$0.00000420, but wait for confirmation that support is actually holding. More aggressive traders might jump in once price breaks and stays above that $0.00000500 resistance with solid volume backing it up. Either way, managing risk is crucial here—setting stops below $0.00000390–$0.00000400 gives you a clear exit if things go south. For anyone holding longer term, just remember that PEPE’s upside is tied heavily to the broader meme coin market and whether it can catch the next wave of speculation.