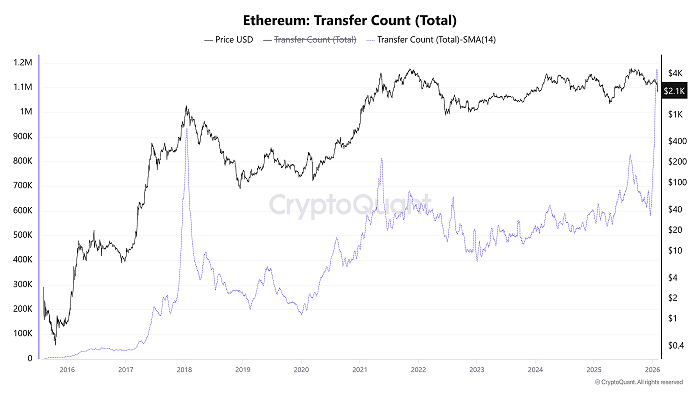
Ethereum’s on-chain ecosystem has lit up with a troublingly familiar signal. In late January, the total transfer count for the Ethereum network—smoothed using a 14-day moving average—surged to 1.17 million. This is not just a number; it echoes prior peaks that foreshadowed market turmoil, most notably in late 2017 and mid-2021. As transfer counts swell and price charts falter, Ethereum finds itself in a pivotal moment heading into the new year.

Transfer Count Explodes as Network Enters Historical Stress Zone
Ethereum’s recent network activity signals an inflection point. The dramatic rise in transfer count suggests something deeper than mere transactional adoption. In fact, the velocity and scale of this burst mirror moments that historically have led to price instability.
According to CryptoQuant data, these types of parabolic network patterns most often occur during emotional apexes—periods when investors panic, reposition en masse, or execute stop-losses at scale. In short, Ethereum’s blockchain is moving faster, but that speed might be coming from fear, not belief.
A Pattern Repeating: Echoes of 2018 and 2021
If today’s metrics feel eerily familiar, that’s because they are. In January 2018, ETH transfer counts ballooned to similar highs mere days before the token hit its cycle top near $1,400. Despite strong sentiment and adoption narratives, that activity preceded a multi-year bear market, sending prices tumbling more than 80% from peak.
Then again in May of 2021, Ethereum witnessed a comparable network lurch. Transfers surged just as Elon Musk-fueled Bitcoin pessimism took down crypto’s broader ecosystem. ETH collapsed from over $4,000 to below $2,000 in weeks. In both cases, surging activity did not reflect enthusiastic inflows—it stemmed from distribution.
On-Chain Data Suggests Volatility Without Direction
The Ethereum blockchain doesn’t lie—but it doesn’t always speak plainly either. High transfer counts cannot by themselves confirm bullish or bearish direction. Yet they remain vital as early indicators of instability.
Heavy inter-wallet and exchange movement generally reflects rotational repositioning or stress-induced liquidations. These “distribution clusters” are often misunderstood as growth, but beneath the surface they highlight a desire to convert or de-risk. Ethereum may not be headed for collapse, but its chain chatter reveals a market grasping for balance in the face of ambiguity.
MVRV Bands Suggest Bottoming Pressure Nears
Adding nuance to Ethereum’s technical profile are its MVRV bands—a measure of market-value-to-realized-value that has previously defined accumulation zones. As of early February, Ethereum’s MVRV band is sliding toward 0.8, a level historically associated with capitulation and base-building.
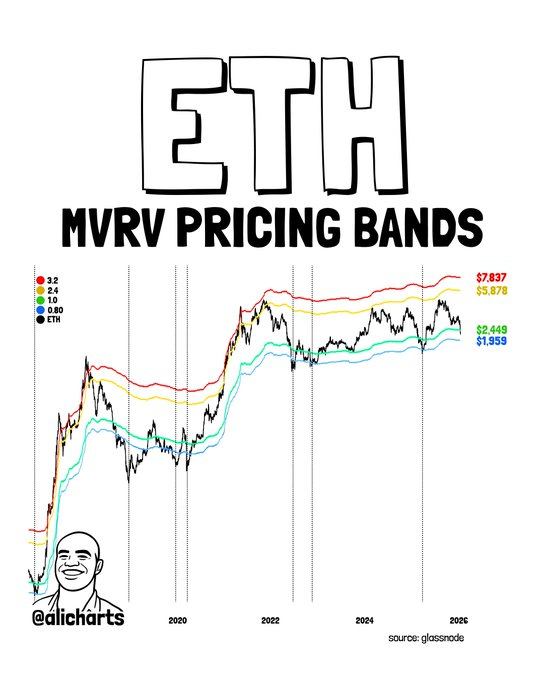
In 2019 and again in 2022, price action formed local bottoms near or just below this metric. If ETH were to test the MVRV 0.8 zone again—currently located just under $2,000—it might signal a final shakeout before a long-term rebound. Of course, defending this level is critical; losing it may invite deeper drawdowns.
Ethereum Caught in the Crosswinds of Transition
Ethereum’s current state is one of tension more than trend. The crypto asset is neither cratering decisively nor rallying convincingly. Instead, it trades in what can best be described as a recalibration phase—where fundamentals, speculation, and emotion collide.
The surge in transfer count might be interpreted as excitement or as hedging. Meanwhile, on-chain data points to increased risk appetite in some corners of the market, coupled with precautionary moves by others. Investors would be wise not to assume direction, but rather interpret these signals as symptoms of a system searching for its next equilibrium.