Recent Developments and Market Sentiment
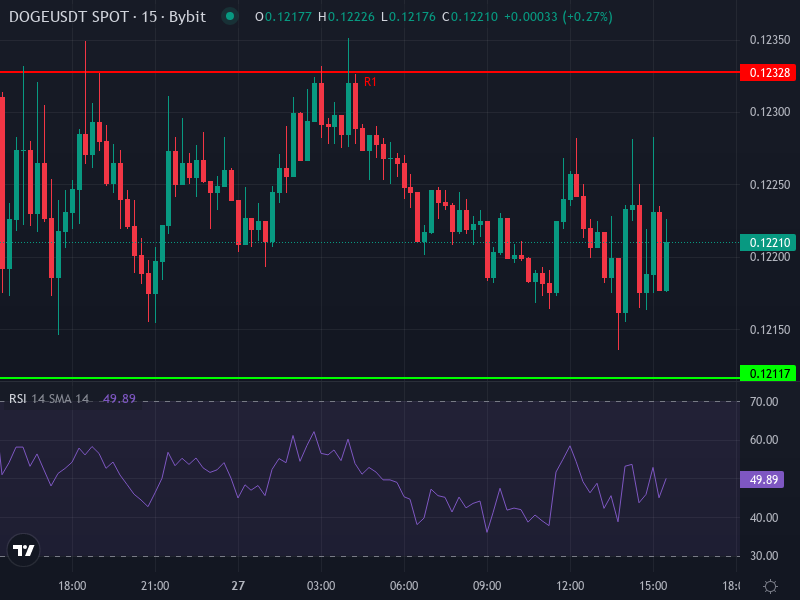
Dogecoin is currently hovering around $0.12194, down about 0.59% over the last 24 hours. The technical picture isn’t looking particularly strong right now – most moving averages are flashing “Strong Sell” signals, suggesting weakness in both short and medium-term trends. The 5-day and 10-day simple moving averages are sitting below the current price, which typically points to bearish pressure building up. Meanwhile, the 14-day Relative Strength Index is hanging around 45, putting it in neutral territory – not oversold, but not showing much strength either.
On a more positive note, there’s been some interesting fundamental developments for DOGE lately. The big news is the approval of a Dogecoin ETF in the United States, which is a pretty significant milestone. It shows that even memecoins are starting to gain institutional legitimacy. Beyond that, wrapped Dogecoin has found its way into DeFi through layer-2 protocols, opening up new use cases like staking and lending. This could give DOGE more utility beyond just speculation and trading.
Indicator-Driven Technical Analysis
Looking at the recent four-hour data for DOGE/USDT, here’s what the indicators are telling us:
- RSI (4-hour): ~44.10 — This is sitting just below the neutral 50 mark, suggesting mild bearish momentum. Nothing dramatic, but the pressure is slightly downward rather than upward.
- MACD (4-hour): MACD line −0.0008478, signal line −0.0011366, histogram +0.0002888 — Here’s something interesting: we’re seeing a recent crossover with the MACD line moving above the signal line. This could hint at a potential short-term bullish reversal, though the values are still pretty weak overall and close to zero.
- SMA / EMA (4-hour): Both moving averages are sitting around $0.1232 to $0.12345, which means they’re above the current price and acting as resistance. The fact that DOGE is trading below these levels confirms the shorter-term bearish bias we’re seeing.
- Daily Pivot Points: Support levels are stacked at $0.12117 (S1), $0.12022 (S2), and $0.11906 (S3). On the resistance side, we’ve got $0.12328 (R1), $0.12444 (R2), and $0.12539 (R3). The main pivot point is near $0.12233. These levels suggest DOGE is trading in a pretty tight range right now, and it’ll take a decisive move to break out either direction.
Price Projections and Scenarios
With indicators showing a mixed but slightly bearish lean, there are a couple of realistic paths DOGE could take in the near to medium term:
Bearish Scenario (Base Case)
If the resistance around $0.1232 to $0.1235 continues to hold, we’ll probably see DOGE drift down toward those daily support levels. The first test would likely be S1 at $0.12117. If that level breaks, we’re looking at S2 around $0.12022. Once we dip below $0.120, there’s a real possibility of heading toward $0.119 or even lower. The volume profile right now doesn’t show strong buying interest, so any downward movement would probably be gradual unless some negative catalyst hits the market.
Bullish Reversal Potential
On the flip side, if DOGE manages to push through that 4-hour moving average zone around $0.1233 with decent volume behind it, that positive MACD histogram could fuel a rally. We’d be looking at a move toward R1 at $0.12328 first, potentially extending to R2 at $0.12444. If momentum really picks up and breaks R2, R3 near $0.1254 comes into play. In this scenario, we’d expect the RSI to climb into the 55-60 range, which would confirm the bullish momentum shift.
Key Risks and Catalysts to Watch
There are several headwinds worth keeping an eye on. The broader crypto market still faces inflationary pressures, and any regulatory setbacks could hurt sentiment. There’s also the fundamental issue of DOGE’s constantly expanding supply, which dilutes value unless demand keeps pace – whether through DeFi adoption, payment integration, or ETF inflows. On the positive side, increased ETF activity, further DeFi integrations (especially cross-chain developments), and any bullish commentary from major holders or institutions could really shift the narrative.
Watch closely where the daily candle closes relative to that pivot point at $0.1223. Volume is key too – if we see a spike accompanying a move above $0.1233 resistance, that would be significant. Also keep an eye on whether higher timeframe indicators start confirming any bullish divergence.
Outlook: Stepping into Mid-2026
Right now, DOGE is really at a crossroads. In the near term – we’re talking days to a few weeks – it’s probably going to stay range-bound between support around $0.119-$0.121 and resistance near $0.125. If the stars align with some bullish catalysts, there’s potential for a breakout toward $0.130. But if volume stays weak and we don’t get any positive macro tailwinds, there’s a real risk of slipping below $0.115 if those key support levels give way.
The bottom line is that DOGE has the setup for a potential reversal, but it needs to convincingly break through several resistance barriers first. Without that, the path of least resistance is probably more consolidation or a gentle decline. It’s a wait-and-see moment.