Recent Developments & Market Backdrop
The meme token Dog (Bitcoin), better known as $DOG or “DOG•GO•TO•THE•MOON”, runs on the Runes protocol that’s built right on top of Bitcoin’s main network. It came out in April 2024 through a fair airdrop to people holding Bitcoin Ordinals, and there weren’t any pre-mines or insider deals—something the Bitcoin purist crowd really appreciates.
Over the last week, the team behind DOG has shared some interesting updates about where things are headed: they’ve teamed up with Bitflow to let people make recurring purchases without going through KYC verification, they’re working on non-custodial automated market maker stuff with Nexus and DotSwap, and there’s been more institutional interest with C2 Blockchain adding to their DOG position. People are seeing these as positive signs for real utility and growing demand.
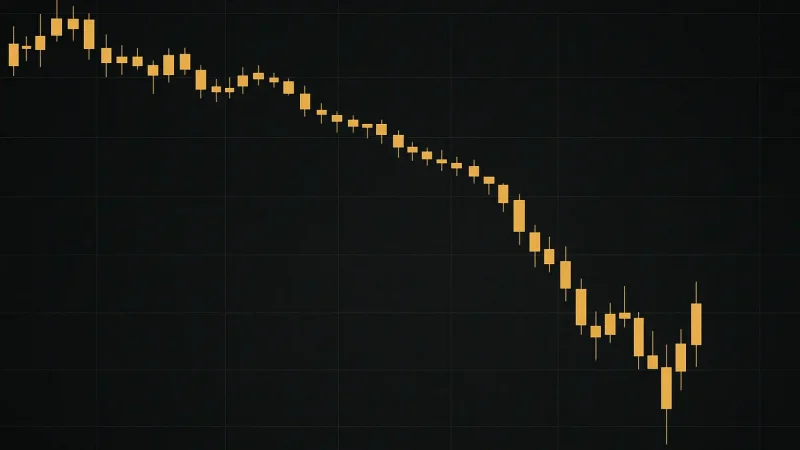
That said, there are some bigger pressures weighing things down. Bitcoin’s price swings, the overall vibe in the meme coin space, and just how speculative DOG is by nature all create a lot of volatility. When the whole sector pulls back, DOG can take an even harder hit. Recent analysis has pointed out that DOG tends to drop more than Bitcoin does when BTC is having a rough time.
Current Technical Indicators & Possible Price Trends
Right now DOG is trading around $0.00077083 (looking at DOG/USDT), and the signals are pretty mixed—though most short-term indicators are leaning bearish. Here’s what stands out:
- Moving Averages: DOG is sitting below most of the common short and medium-term moving averages (the 20, 50, and 100-day), which means those levels are now acting as resistance. For traders who watch MA crossovers, this looks bearish until DOG can break back above them.
- RSI & Momentum Indicators: The daily RSI is hovering in the 30-40 range—getting close to oversold territory—which suggests buyers aren’t showing much strength yet, though it hasn’t totally bottomed out. The MACD is showing negative or weak readings in several analyses.
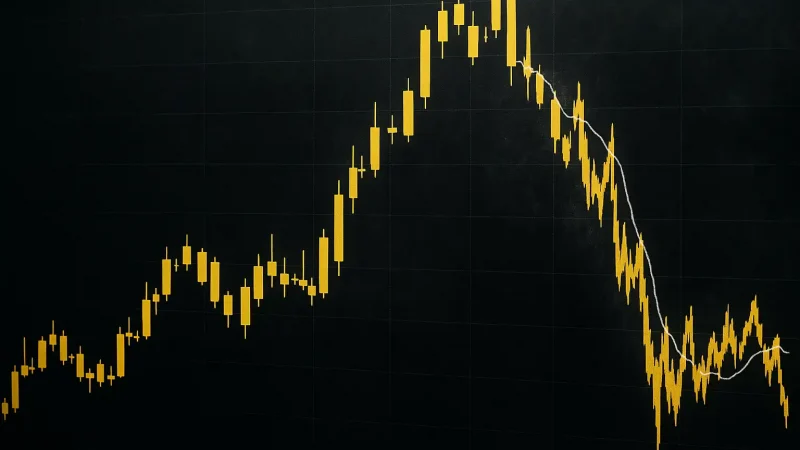
- Volatility & Support Zones: Like most meme tokens, volatility is pretty high. There’s a key support level around $0.00075. If that breaks, we’re probably looking at a retest of $0.00070. On the upside, resistance sits near $0.00100, with stronger walls up around $0.00140–$0.00160 if any real momentum kicks in.
Near-Term Scenarios (Next 48-72 Hours)
If Bitcoin can hold above the $69,000–$70,000 range and meme coin sentiment doesn’t get worse, DOG will probably bounce around between $0.00075 and $0.00085. Breaking above that $0.00100 resistance would need some serious volume and follow-through, and honestly that seems unlikely without some kind of positive trigger across the sector.
Mid-Term Outlook (Weeks to Months)
If momentum picks back up—maybe from money rotating into speculative coins, new exchange listings, or good Bitcoin-related policy news—DOG could push up to test that $0.00140–$0.00160 resistance range. On the flip side, if Bitcoin weakens, there’s bad regulatory news, or the hype dies down, we could see support tested as low as $0.00060–$0.00070.
Important Technical Risks & Trigger Levels
Knowing what would kill the bullish case is just as important as knowing the upside targets:
- Trigger for Bearish Bias: A clean break below $0.00070 with solid volume would likely open things up for deeper drops. You might see some temporary bounces from oversold conditions, but they’d get crushed if the selling really picks up.
- Trigger for Bullish Recovery: A daily close above key moving averages—especially the 20 or 50-day EMA—and particularly above that $0.00100 resistance would flip the short-term trend. If Bitcoin also holds above $70,000, DOG could really gain some traction.
- Indicators to Watch: RSI breaking above 50, MACD showing a bullish crossover, and volume increasing on the way up. Also keep an eye out for volatility contractions—like an ATR drop or Bollinger Band squeeze—which often happen before a breakout.
Forecast Summary & Investor Implications
Looking at everything we’ve got:
- Base case: DOG probably trades sideways or drifts down a bit over the next few days—likely between $0.00070 and $0.00090—unless something positive comes along to shake things up.
- Optimistic scenario: If DOG breaks above $0.00100 with decent volume and Bitcoin stays stable or climbs, the path opens up toward that $0.00140–$0.00160 resistance zone.
- Pessimistic scenario: A drop below $0.00070 could trigger more selling, pushing DOG down toward $0.00050–$0.00060, especially if meme coin sentiment turns sour or Bitcoin takes a serious dive.
For active traders, your best bet is to look for entries around support levels and keep your risk tight. For longer-term holders, pay attention to what’s happening with the network—things like AMM data, new exchange listings, and ecosystem tools—because those could be bigger drivers of upside than just technical levels. And remember, technical analysis works best when you’re also keeping tabs on what’s happening in the broader crypto market.