Introduction: Meme Coin Environment & Recent Context
The BOOK OF MEME token (BOME/USDT) is a Solana-based meme coin that’s been riding the AI narrative wave, and right now it’s going through some pretty rough volatility as investor sentiment shifts. Like most meme coins, its value is driven more by community hype and broader altcoin market rotations than any real underlying utility. While BOME has gotten some attention from institutional circles through CoinW Research’s SCORE model, the current price action tells a different story — it’s struggling to hold onto key support levels that previously acted as a floor. What used to be resistance areas are now make-or-break zones that need defending if we want to avoid deeper losses. Recent technical readings are painting a pretty bearish picture, with moving averages and momentum signals all pointing downward.
Current Technical Indicator Analysis & Price Levels
As of the latest trading session, BOME is sitting at around 0.0007221 USDT, down roughly 7% on the day. Looking at the 4-hour chart, the Relative Strength Index (RSI) is hovering near 44.4 — not quite oversold, but definitely leaning toward the lower end of neutral territory. The MACD line has dropped well below its signal line, creating a negative histogram that shows momentum is clearly fading in the short term. The moving averages aren’t doing the bulls any favors either: the 4-hour Simple Moving Average sits around 0.0007755, and the Exponential Moving Average is near 0.0007482 — both sitting above the current price like a ceiling, creating overhead resistance.
When we zoom out to the daily timeframe, the pivot point analysis shows resistance levels stacked between roughly 0.0007703 and 0.0008483 USDT, while support levels are spread out below, ranging from 0.0006923 down to 0.0006143 USDT. BOME is currently trading beneath both its 50-day and 200-day EMAs on the daily chart, which confirms we’re in a downtrend. The ADX indicator is showing rising trend strength too — which actually means this bearish move might be gaining steam rather than running out of gas.
Key Support & Resistance Zones
- Immediate Resistance: The 0.000748-0.000775 area lines up with short-term moving averages and recent price rejection zones — this is the first hurdle any bounce needs to clear.
- Major Resistance Zone: Between 0.000770-0.000850, marked by daily pivot resistances. This range represents the upper boundary for any meaningful relief rally attempts.
- Support Levels: First support at roughly 0.000692, second support near 0.000659, and the critical third support around 0.000614 USDT. If price breaks below that second support level, things could get ugly fast with the third support becoming the last line of defense.
Forecast Scenarios and Risk Monitoring
Looking ahead, there are really two paths this could take: either we continue bleeding lower, or we get a bounce attempt back into resistance.
Bearish scenario: If BOME can’t hold above that 0.000692 USDT support level, we’re probably looking at further downside toward 0.000614 USDT or lower. With sellers in control and volume staying weak, we could easily see momentum swing into oversold territory with even wilder price swings. Pretty much all the momentum indicators — Williams %R, CCI, and ADX — are favoring the bears right now.
Bullish scenario: For bulls to get any traction, we’d need to see a strong move above the 0.000748-0.000775 resistance zone, backed by solid volume and ideally a MACD crossover turning positive. If that happens and the price actually holds above those levels, we might see a push toward the 0.000800–0.000850 range. But here’s the thing — those levels have rejected rallies before, so it would take a real shift in sentiment and a surge in buying pressure to break through.
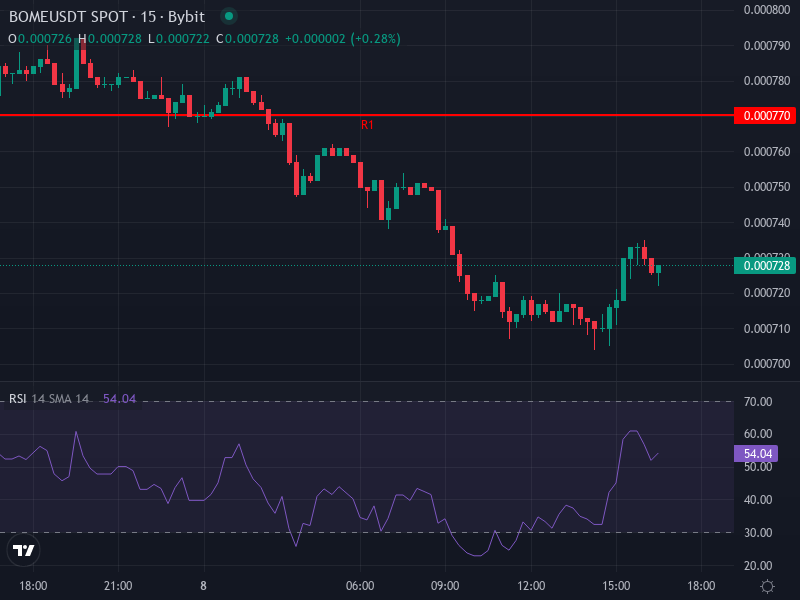
Price Chart Reference
A visual reference really helps put all these levels into perspective. The chart below captures the recent price movement, moving averages, and those pivot levels we’ve been discussing.
Outlook: What Traders Should Watch
Volume is going to be absolutely critical here — watch for any unusual spikes in 24-hour trading volume above the recent average. Rallies that happen on weak volume are usually trap moves that don’t last. Also keep a close eye on the MACD histogram for any shifts and watch how RSI behaves near extreme levels. If we get oversold readings combined with bullish divergence patterns, that could signal a bounce is coming. On the flip side, if those support zones give way, expect things to accelerate downward as stop-losses get triggered in waves. Bottom line: traders should be pretty cautious about taking any long-term positions here until BOME manages to reclaim either its 50-day or 200-day EMA on the daily chart — that would be the first real sign of a potential trend reversal.