Recent Developments and Market Context
Throughout 2025, Bonk — the Solana-based meme token — has caught quite a bit of attention thanks to some serious developments. We’re not just talking about Twitter hype anymore. Institutional money has started flowing into Solana-native projects, corporate partnerships are forming, and ecosystem expansion programs like LetsBonk are gaining real traction. Perhaps the most notable news was Safety Shot Inc.’s massive $25M financing commitment in BONK tokens. That kind of backing has shifted the conversation around BONK from pure speculation toward something that looks more like genuine utility and staying power.
Around the same timeframe, a $1B Solana fund led by Galaxy Digital and other heavyweight players launched, adding serious credibility to the narrative that SOL is gaining institutional respect. This kind of momentum in the broader Solana ecosystem naturally tends to lift projects like BONK along with it. On top of that, there’s even discussion now about a Bonk-based ETF structure called the “Bonk Income Blast ETF.” The idea is to offer exposure to BONK while using options strategies to generate income and provide downside protection. Whether you’re a believer or a skeptic, it’s clear that BONK is being treated with increasing financial sophistication.
Technical Indicators: What Market Data Is Telling Us Now
Right now, BONK is trading at around 0.0000081573 USDT, up a modest 2.03% over the past 24 hours. That uptick sounds encouraging, but it’s important to zoom out and look at the bigger picture before drawing any conclusions. The price action has been choppy, and technical signals are giving us a fairly mixed bag.
Momentum & Oscillator Indicators
Looking at the 4-hour chart, the RSI sits near 47.63. That’s right in the middle zone — not overbought, not oversold — which essentially means momentum is pretty neutral at the moment. The MACD histogram is showing a tiny positive reading, but the MACD line is still sitting below its signal line. Put simply, there’s a faint hint of bullish potential, but nothing that screams “breakout incoming” just yet.
Moving Averages & Support/Resistance Landscape
The moving average picture is similarly mixed. Short-term EMAs and SMAs (the 5-, 10-, and 20-period averages) are holding up the current price, which is a positive sign. However, the longer-term moving averages — the 50-, 100-, and 200-period lines — are mostly flat or even starting to slope downward. That tells us the bigger trend hasn’t fully turned bullish yet. On the charts, key resistance appears to be forming around the 0.00000844 USDT level and above, while support is sitting closer to 0.00000802 USDT and below.
Price Prediction Scenarios Based on Technicals
Given where things stand right now — mixed technicals, promising news flow, but no clear breakout — there are two main scenarios worth watching over the next few weeks to a couple of months.
Scenario A – Bullish Breakout: If BONK manages to push above that short-term resistance around 0.00000844 USDT with solid volume behind it, we could see a nice rally toward the 0.00000950–0.00001050 range. Breaking cleanly above 0.00001000 would be a big psychological win and could attract fresh institutional interest, especially with the ETF chatter and ongoing corporate purchases like Safety Shot’s. In this scenario, we’d expect volume to pick up noticeably and the shorter-term EMAs to provide solid support on any pullbacks.
Scenario B – Consolidation or Downside Risk: On the flip side, if BONK fails to break through resistance, we’re likely looking at a retest of support around 0.00000802–0.00000790. If those levels don’t hold, the next meaningful support zone sits closer to 0.00000770 or even lower. In this case, expect sideways, choppy trading with occasional bursts of volatility. Any broader crypto market weakness — regulatory crackdowns, Solana-specific hiccups, or macro risk-off sentiment — could amplify the downside pressure.
Indicators to Watch Closely
To figure out which way this is going to go, here are the key things to keep an eye on:
- Volume spikes — especially if they come alongside upward price moves. That’s what confirms real conviction.
- MACD crossover on the daily timeframe — if the MACD line crosses above its signal line, that’s a classic bullish signal worth paying attention to.
- Moving average alignment — watch for a potential Golden Cross, where shorter-term MAs cross above longer-term ones. That would be a strong bullish indicator.
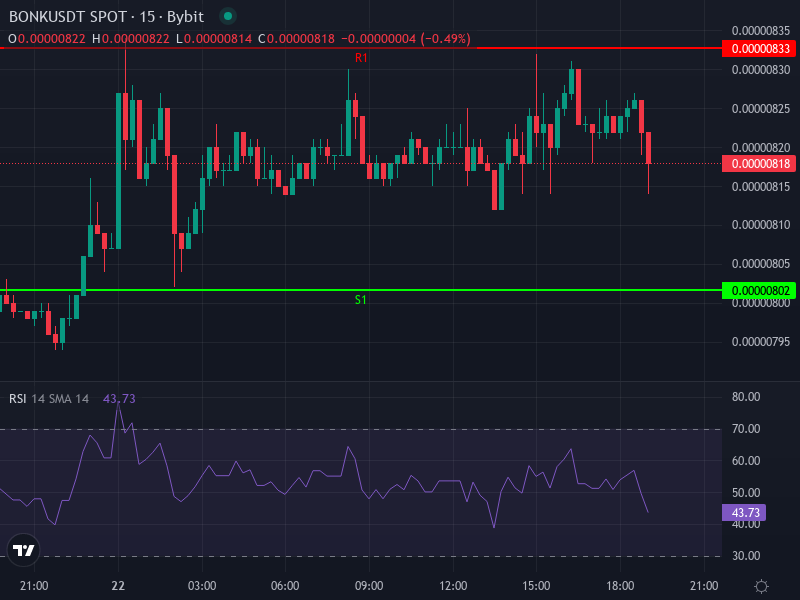
- Support breach — if we lose the 0.00000800–0.00000802 zone, things could get uncomfortable quickly.
Price Graphic
Emerging Risks and Considerations
While there’s definitely room for upside here, it’s important to stay realistic about the risks. Meme tokens like BONK are still heavily driven by sentiment and social media buzz. Any negative headlines around Solana — whether that’s network outages, regulatory scrutiny, or developer drama — tend to hit BONK hard. There’s also the risk of long-term holders creating resistance as they look to exit at certain price levels. And while the ETF and corporate adoption stories are exciting, they also raise expectations. If those narratives fail to deliver tangible results, we could see sharp selloffs as traders lose patience.