Recent Developments & Market Context
ApeCoin’s ecosystem keeps pushing forward despite some rough winds in the broader crypto market. The big news lately is AIP-582 passing, which basically overhauls how the DAO runs and starts moving ApeChain toward governance that actually happens on-chain. They’re also tying funding to hitting specific milestones now, which means we’ll actually know which proposals get money and when. It’s a nice step toward transparency and should help ApeCoin look more legitimate to bigger players.
On the practical side, ApeChain keeps adding partnerships—ZEUSxPay, ShopWithCrypto, and Apollo Wallet are all coming onboard to expand where you can actually use APE in real life, particularly for buying stuff and payments. These developments fit into the bigger push for layer-3 solutions and Web3 infrastructure, though honestly, the market’s attention right now is all over the place because of macro uncertainty and overall sentiment being what it is.
Technical Indicator Snapshot (4-Hour Frame)
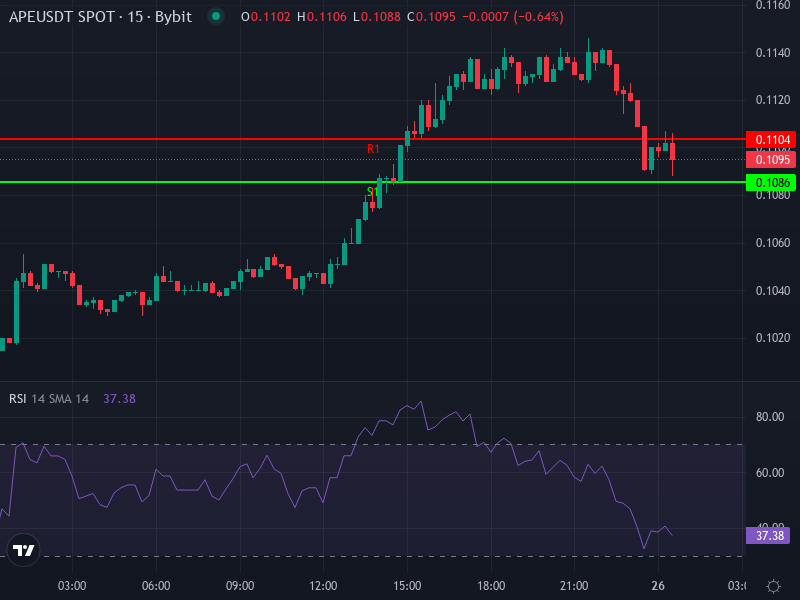
Right now, ApeCoin is trading around 0.1096 USDT, up roughly +7.79% over the last 24 hours. Looking at the 4-hour chart:
- RSI is sitting at about 54.4: Pretty neutral territory—not overheated, not oversold. There’s room for buyers to push, but they might hit some walls.
- MACD line (around -0.000066) versus Signal (around -0.001456): We’ve got a bullish crossover here, with MACD climbing above the signal line and the histogram ticking up. That’s pointing toward some building buying pressure.
- 4-hour SMA is near 0.10631 USDT, and the 4-hour EMA is closer to 0.10768 USDT. Price is above both, which tells us short-term buyers are active.
- Daily pivot levels: Resistance sits at around 0.11037 (R1), 0.11133 (R2), and 0.11217 (R3). Support levels are at roughly 0.10857 (S1), 0.10773 (S2), and 0.10677 (S3). We’re basically right at that critical zone just below R1 and just above the daily pivot—a real testing ground.
Short-Term Price Paths & Key Levels
Putting together what’s happening in the news and what the charts are telling us, here’s what could play out for APE/USDT over the next several hours to days:
Bullish Scenario
If buyers can push through and hold above that R1 pivot (around 0.11037 USDT) with decent volume backing it up, we’re looking at a potential run toward R2 and R3 levels, somewhere in the 0.11130-0.11220 USDT range. The MACD signal supports this move, especially given the bounce off those SMA/EMA levels. The real test will be at R2—if momentum carries past that, things could really start moving.
Bearish Scenario
If price stalls out around R1–R2 and starts pulling back, we’ll be watching those support zones at S1 and S2 (roughly 0.1085-0.1077 USDT) pretty closely. Breaking below S2 could drag things down toward S3 (around 0.10675 USDT). The RSI being neutral means any selloff probably won’t be super aggressive, but if those support levels don’t hold, we could see more bearish momentum build.
Market Sentiment & Risk Factors
The momentum here is pretty fragile, to be honest. Sure, the 4-hour MACD looks bullish, but when you zoom out to daily timeframes, things look mixed at best—borderline bearish. Those longer-period moving averages are sitting well above where we’re trading now, and indicators like ADX and volume aren’t exactly screaming buyer confidence. Daily technical summaries are actually leaning “Sell,” especially when you factor in those longer SMAs and EMAs.
Any big news—governance announcements, new ApeChain utility features, stuff like that—could spark sudden interest and move things fast. On the flip side, macro shocks like tightening liquidity, regulatory crackdowns, or a broader cooling off in NFT and Web3 enthusiasm could kill any upward movement pretty quickly. Keep a close eye on volume spikes and how price reacts at resistance levels for confirmation either way.
Key Zones to Watch
Upside targets: Around 0.1113–0.1122 USDT if we break R1 cleanly, potentially extending to about 0.1135 USDT if momentum really holds.
Downside risk zones: Around 0.1085 USDT is the first line of defense; if that breaks, we’re looking at 0.1077 USDT and possibly down toward 0.1067 USDT.
Final Insight
ApeCoin is sitting right at a technical crossroads. Buyers have a slight edge in the 4-hour timeframe, but those longer timeframes are still looking pretty bearish. If we get a solid close above roughly 0.111 USDT with good volume, we could see a short-term rally. But if that follow-through doesn’t materialize, we’re probably looking at more choppy sideways action or retests of lower support levels. For traders watching risk carefully, setting tight stops just below key supports and taking profits near resistance makes sense from a risk-reward perspective. Long-term holders might see these price levels as decent accumulation zones—though that really depends on how much you believe in ApeChain’s growing utility and the broader Web3 adoption story.