Market Context and Recent News Drivers
Right now, ApeCoin is hovering around $0.1451, down roughly −1.26% in the last 24 hours. It’s been a rough patch for the broader crypto market, especially for Web3 and NFT-related tokens. Recent analysis shows that ApeCoin’s flagship ecosystem—ApeChain—has taken a serious hit. TVL (Total Value Locked) has plummeted more than 80% from its late 2024 peak and is now sitting somewhere between $5 and $7 million. Developer engagement has slowed to a crawl, and there just aren’t many revenue-generating protocols on the chain anymore. All of this adds up to a pretty risky outlook for APE in the near term. There’s also been a major governance shakeup: the ApeCoin DAO got dissolved through AIP-596, and everything’s now handled by a centralized outfit called ApeCo. It’s a strategic shift—less community coordination, more top-down execution.
That said, there are still some potential bright spots on the horizon. The “Project R.A.I.D.” initiative is moving forward, aiming to expand cross-chain reach with bridges to Solana, Hyperliquid, and BNB Chain, plus various content and usage incentives. Despite infrastructure improvements—like integration with multiple chains and easier access through major exchanges—actual on-chain activity remains pretty lackluster. Without real user demand picking up, these structural improvements might not do much for the price in the short run.
Technical Indicators: Current Readings and Key Levels
Looking at the latest 4-hour chart for APE/USDT, we’re seeing several warning signs:
- RSI (4h): Sitting at roughly 38.7, which puts it below the neutral 50 line but not quite in oversold territory. Momentum is weak, and while there’s room for a bounce, we’re not seeing any strong bullish signals just yet.
- MACD (4h): The MACD line is dipping slightly below its signal line, though the histogram shows a tiny positive tick. This hints at minor bullish divergence—maybe consolidation or a small reversal—but nothing strong enough to bet on a breakout with confidence.
- Moving Averages (4h): The simple MA is around $0.1501, and the exponential MA sits higher at about $0.1519. APE is trading beneath both of them, which tells us the short-term trend is still leaning bearish.
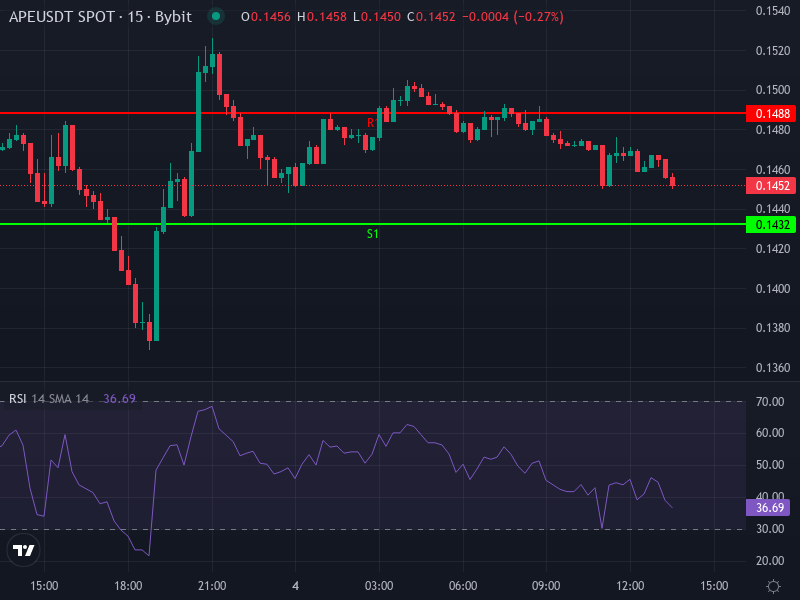
- Daily Pivot Points: Today’s pivot is roughly $0.14687. Immediate resistance levels (R1–R3) fall in the $0.1488-$0.1544 range, while support zones (S1–S3) are down around $0.1432-$0.1376. These are the key levels to watch if volatility kicks in during the day.
- Daily ROC (Rate-of-Change): It’s negative, reflecting recent selling pressure. This raises the risk of further drops unless we see strong buying interest or some kind of external catalyst.
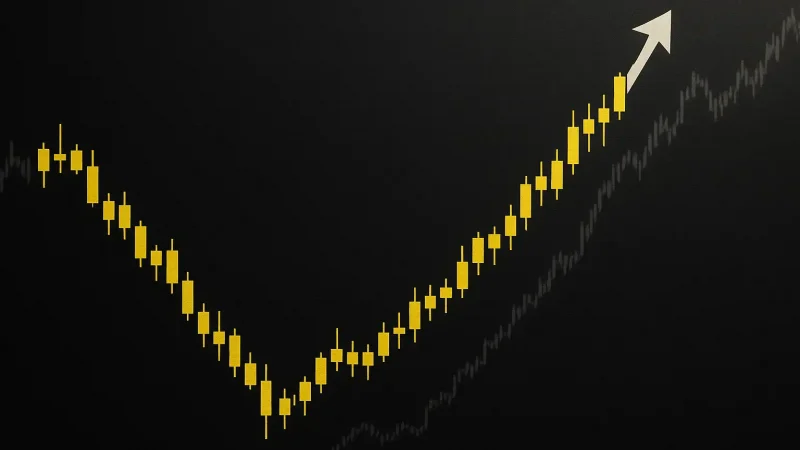
Here’s a visual of the recent price action to help put these levels in perspective:
Price Scenarios and Forecasts
With everything we’ve looked at—both fundamentals and technicals—here are a few plausible scenarios moving forward:
Bearish Base Case
If the selling pressure keeps up, APE could easily drift down toward the first support level around $0.1432 (S1). If that breaks and holds below, we could see a slide toward the $0.1376-$0.1400 range (S2 to S3), especially during low-volume or risk-off sessions. In this scenario, short-term holders would take a hit, and any meaningful recovery would become a lot harder as sentiment sours further.
Neutral Drift / Sideways Range
Without fresh catalysts, we might just see APE chop sideways between $0.1432 and $0.1519. Price could bounce between R1 (around $0.1488) and support at S1, testing both levels but never really breaking through cleanly. This would suggest consolidation, probably with trading volume staying flat or declining. Range traders might find opportunities here—buying near support and selling near resistance in short-term plays.
Bullish Upside Scenario
For bulls to take control, APE first needs to break convincingly above the moving averages around $0.1501-$0.1519. A solid close above the 4-hour EMA would open the door to test the daily resistance zones—first R1 (around $0.1488), then R2 (roughly $0.1525), and eventually R3 (about $0.1544). Beyond that, any serious upside will depend on real improvements in the ecosystem—things like rising TVL, more developer activity, or big news like new partnerships or exchange listings. If the stars align, a move back toward $0.1600-$0.1700 isn’t out of the question—but it’ll only happen if resistance gives way and buyers show up with conviction.
Strategic Implications for Traders and Investors
For traders: the current setup demands careful risk management. If you’re looking to go long, be conservative—maybe enter near support with tight stop losses (like below S2 or S3). Short-term swing trades should focus on catching bounces, but only when volume and indicators (like the MACD histogram) line up clearly. Watch out for fake breakouts above the moving averages if volume stays thin.
For long-term investors: the shift from DAO governance to ApeCo is a double-edged sword. Sure, it might lead to faster decision-making and more cohesive strategy, but it’s also controversial. Without strong user growth, genuine utility expansion, and renewed developer commitment, the risk stays elevated. If you’re thinking about putting money into APE at this price, keep your position size modest and diversified, and keep an eye on broader trends in NFTs, gaming, and DeFi.