Recent News and Context
Pudgy Penguins’ native token PENGU has been making waves lately, though not all for good reasons. The big story? Their proposed hybrid token-and-NFT ETF just got pushed back to March 11, 2026. That delay has definitely rattled some cages in the market, causing derivatives activity to cool off and the token to drop about 6% as traders try to figure out what this means for institutional adoption down the road.
Looking at the bigger picture, altcoins have been having a moment in early 2026, and PENGU jumped over 45% year-to-date before hitting this rough patch. Right now, it’s bumping up against some serious resistance between $0.0128 and $0.0135. Analysts are saying if it can punch through those levels, we could see some exciting moves higher. But there’s a catch – the technicals are showing some warning signs, and market sentiment feels a bit shaky.
On the project side, Pudgy Penguins isn’t sitting still. They’re pushing hard into physical products at retail, building out their brand through Abstract Network, and adding more utility to their NFTs. That said, NFT sales have dropped off noticeably in recent weeks, which shows just how tricky it is to keep both the speculative crowd and the utility-focused investors happy at the same time.
Technical Indicators & Price Predictions for PENGU/USDT
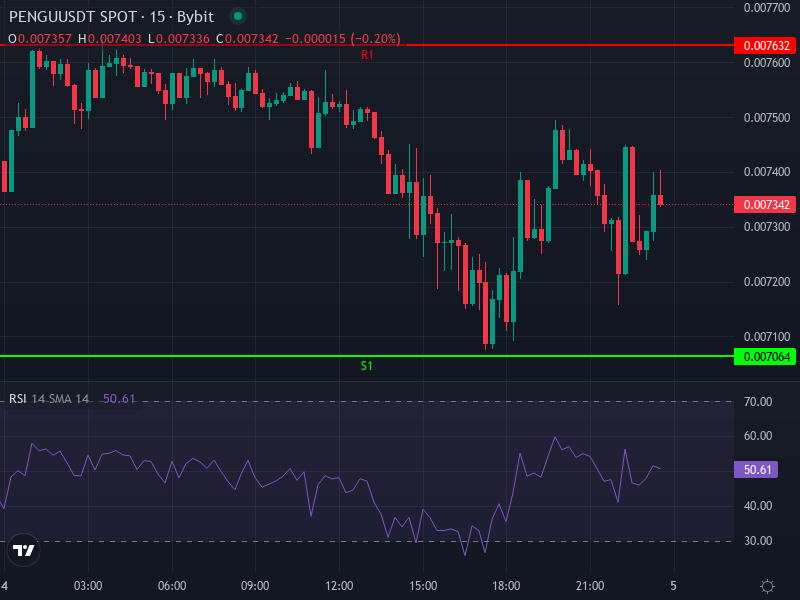
As of now, PENGU is trading around 0.00735070 USDT, down about 0.92% in the last 24 hours. Nothing dramatic, but the momentum doesn’t exactly inspire confidence either. Looking at the 4-hour chart, the RSI is sitting at roughly 37.33 – that’s in bearish-to-neutral territory, meaning buyers aren’t exactly rushing in. Though honestly, if support holds here, we could see a decent bounce.
The MACD tells a similar story. On the 4-hour timeframe, it’s slightly negative with the MACD line at -0.000253 versus the signal at -0.000281. The histogram shows a tiny positive reading of about +0.0000279, which suggests the price might be trying to turn around, but it’s hardly convincing yet. We need stronger confirmation before getting too excited.
Moving averages aren’t helping much either. The 4-hour SMA is around 0.0077288 and the EMA is about 0.0078601. Since PENGU is trading below both of them, the short-term trend leans bearish. These moving averages are basically acting as ceiling right now – the price needs to climb above them to shift the mood more positive.
Looking at the pivot point levels for today, we’ve got the main pivot sitting at roughly 0.00735233. Resistance levels stack up at R1 around 0.0076317, R2 at 0.0079203, and R3 at 0.0081997. On the downside, supports come in at S1 around 0.0070637, S2 at 0.0067843, and S3 at 0.0064957. With the price basically sitting right on the pivot, the R1–R2 zone will be critical if we get any bounce. If selling pressure continues, those S-levels will be put to the test.
Short-Term Scenarios: Bounce vs Breakdown
So what happens next? Well, there are two main paths from here.
If buyers decide to step up:
- PENGU could push back toward R1 (around 0.00763) and R2 (around 0.00792) pretty quickly. If volume really picks up and the broader market cooperates, R3 (around 0.00820) becomes a realistic target.
- The key would be breaking cleanly above that 4h EMA (around 0.00786) and SMA (around 0.00773). That would signal a shift in short-term sentiment from bearish to bullish.
But if the bears keep control:
- Losing the pivot level (around 0.00735) would open the door to S1 (around 0.00706) and S2 (around 0.00678). If S2 breaks, things could get uncomfortable fast, with S3 (around 0.00650) and potentially deeper drops on the table.
- Watch out for bearish divergence on the MACD or big down candles with heavy volume at resistance – those would amplify the downside risk significantly.
Integrating Broader Sentiment & Risk Factors
Even if the technicals suggest a bounce could happen here, we can’t ignore the bigger picture risks. That ETF decision hanging over everything is a double-edged sword – sure, institutional demand could be huge if it gets approved, but regulatory uncertainty cuts both ways. Then there’s the NFT sales decline and what looks like retail investors pulling back, suggesting the speculative frenzy might be cooling off.
Another thing to consider: PENGU trades mostly against USDT, which makes it vulnerable if anything weird happens in the stablecoin world – whether that’s regulatory pressure, a shift toward USDC, or liquidity concerns.
And let’s be real, what Bitcoin and the major altcoins do matters a ton here. When BTC rallies, it tends to lift risk assets like PENGU. But if we get a broader market pullback, PENGU could easily slice through those support levels we talked about.
Projected Price Range and Key Levels to Watch
Putting it all together – the technicals, the current range, and the near-term risks – here’s what seems most likely:
- **Moderate Bull Case**: If that 0.00735 support level holds and we see some momentum come back, the first meaningful target sits around 0.00820 (R3). That’s a reasonable expectation if things stabilize.
- **Breakout Bull Case**: Now, if PENGU breaks above those moving averages around 0.00786 with solid volume behind it, we could see a push toward 0.00900–0.01050. This becomes more likely if we get positive news on the regulatory front or some clarity on that ETF situation.
- **Bearish Case**: On the flip side, if the pivot fails to hold, we’re probably looking at a move down toward 0.00678 (S2), and possibly 0.00650 (S3). Breaking below S3 would be pretty concerning and could open the door to the 0.00550 area or lower.