Recent Developments and Fundamental Landscape
ApeCoin is heading into early February 2026 with a somewhat conflicting picture on both the fundamental and regulatory sides. There’s some good news on the legal front—a U.S. federal court recently decided that the Bored Ape Yacht Club NFTs and ApeCoin aren’t securities. This is a significant win that lifts a major cloud of regulatory uncertainty and could make it easier for institutions to get involved. The ruling provides much-needed clarity around compliance risks, which is something the market has been craving.
On the governance side, things have changed dramatically. The ApeCoin DAO, which used to run the show, was dissolved mid-2025 following the passage of proposal AIP-596. Now a centralized organization called ApeCo handles the main pieces of the ApeCoin ecosystem—ApeChain, BAYC, and Otherside. The thinking here is that centralization will allow for quicker decision-making and smoother operations.
There’s also some interesting movement on the product front with Project R.A.I.D., which is expanding APE beyond Ethereum into networks like Solana, Hyperliquid, and BNB Chain. This could really broaden its utility in DeFi. But here’s the catch—the actual ecosystem metrics aren’t looking great. TVL on ApeChain has fallen off a cliff, there aren’t many new addresses being created, and daily trading volumes on decentralized exchanges are pretty anemic. So while the infrastructure and governance are getting upgraded, actual user adoption seems to be stuck in neutral.
Technical Indicators: Current Status and Bias
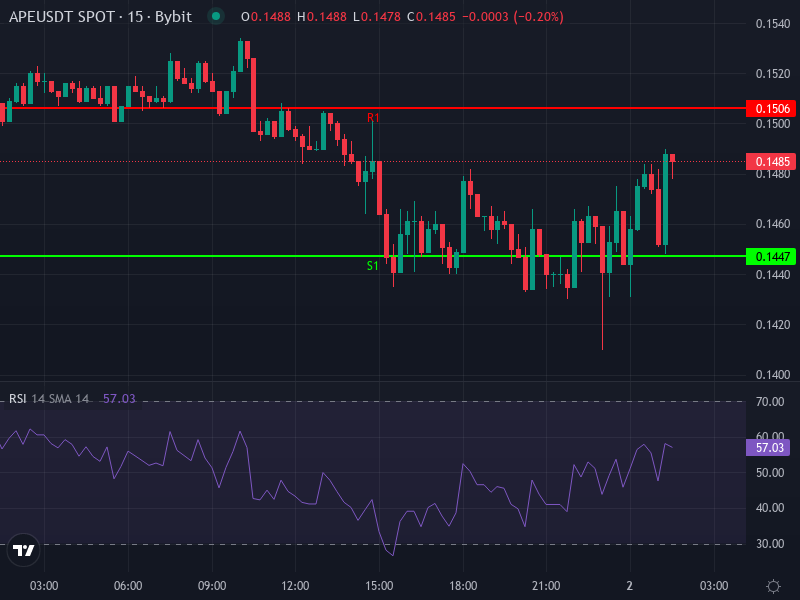
Looking at where APE/USDT is trading right now, the price is hovering around $0.1481, down about 1.38% in the last 24 hours. The technical picture points to a bearish trend, though there are some early hints that a reversal might be possible. On the 4-hour chart, the Relative Strength Index sits at roughly 35.6—that’s bearish momentum, but it’s getting close to oversold levels. The MACD isn’t giving us much hope either: it’s sitting below the zero line with the MACD at −0.00768 and the signal line at −0.00734, plus a negative histogram. All of this points to continued downward pressure without any bullish crossover in sight just yet.
The moving averages are acting as resistance overhead. The 4-hour simple moving average is around $0.1632, and the exponential moving average is near $0.1606. Recent daily pivot levels show immediate resistance at about $0.1506, with the pivot center at $0.1469. Support levels are mapped out at $0.1447 and $0.1410. Since the price is trading below both the SMA and EMA lines, the bearish bias is pretty well confirmed.
Price Prediction Scenarios Through Q2 2026
Bullish Scenario: Reversal Triggered by Uptick in Adoption
If ApeCoin can push up from where it’s sitting now at $0.148 and break through the key resistance around $0.1506, then convincingly get above the moving average overhead in the $0.1606–$0.1632 range, we could see a genuine bullish reversal take shape. That would potentially open the door to $0.180 in the shorter term, a level that lines up with Fibonacci retracement points from earlier highs. For this to actually happen, though, we’d need to see real traction from those integrations on Solana, BNB Chain, or Hyperliquid, along with improvements in the on-chain metrics—things like TVL climbing and more active addresses. A bullish MACD crossover on the 4-hour chart combined with RSI breaking above 50 would give a lot more credibility to any upward move.
Bearish Scenario: Continued Weakness and Downside Risks
On the flip side, if demand doesn’t show up and the price can’t reclaim those resistance zones or hold above the pivot at $0.1469, we’re probably looking at deeper losses. A clean break below the first support around $0.1447 would likely send the price toward $0.1410, and if selling really picks up steam, we could see a drop to $0.1388 or even lower. Ongoing negative MACD momentum with no crossover and RSI staying below 30 would only make the bearish case stronger. Throw in weak ecosystem activity, and institutional money is going to stay on the sidelines, which just reinforces the downward pressure.
Neutral/Transition Phase: Consolidation Below Resistance
There’s also a decent chance that the price just gets stuck between support at $0.1447 and resistance at $0.1506 for a while. In that scenario, ApeCoin would basically be in a holding pattern with short-term swings as the market tries to figure out what to do next—balancing bits of good news like the legal win and adoption headlines against broader risk-off sentiment. Volume would probably drop off during this phase, and the technical indicators might just flatten out: MACD histograms getting narrower, RSI bouncing around in the oversold to low-mid range, somewhere between 30 and 40. For traders, this could create some decent range-trading opportunities while everyone waits to see if there’s going to be a breakout or a breakdown.
Emerging Watchpoints for Traders and Investors
There are a few key things worth keeping an eye on. First, watch the fundamentals—TVL on ApeChain, daily active addresses, and on-chain transaction volumes. These metrics tend to move before price does. Also, pay attention to external developments like those Solana integrations, any new DeFi partnerships, or ecosystem launches—these could act as either catalysts or reality checks. From a technical standpoint, the most important zone to watch is between $0.1506 and roughly $0.163. Breaking above that range is essential for any meaningful upside. On the downside, the support levels at $0.1447 and $0.1410 need to hold, or else we could be looking at a slide toward $0.1388 or lower.