Current Landscape and Recent Developments
The memecoin market continues to be a wild ride, and Ape and Pepe (APEPE) is no exception. Right now, it’s sitting around 0.0000010522 USDT after dropping about 0.51% in the last day. This isn’t exactly surprising—meme coins across the board have been struggling lately as money flows toward bigger projects and more established blockchain networks. A lot of people watching the market are calling this a “meme coin rotation,” where smaller tokens get left behind as traders chase opportunities in larger ecosystems like BNB Chain. When this happens, smaller tokens like APEPE tend to just tread water or drift lower.
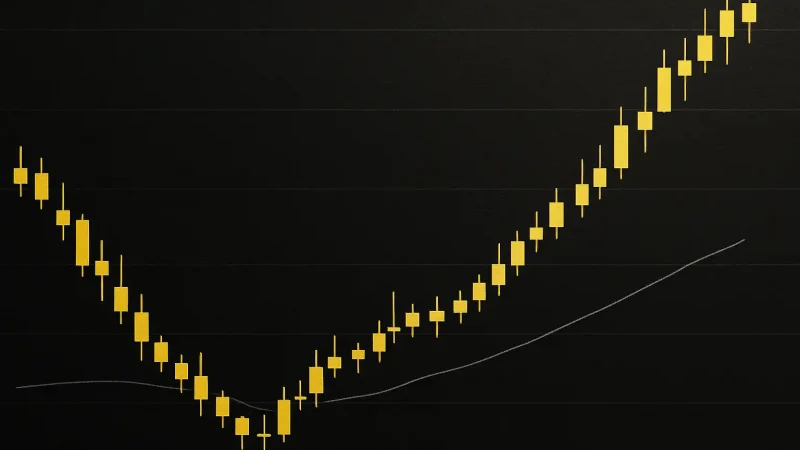
Looking at the charts, things get even more interesting. APEPE is trading well below its 200-day moving average, which sits up around 0.0000016173 USDT. That level used to be a floor that held the price up, but now it’s acting as a ceiling that’s tough to break through. There are some tiny glimmers of hope though—the MACD indicator recently flipped positive, and the price is hovering near a pivot point around 0.0000011108 USDT. But here’s the catch: trading volume has really dried up, which makes you wonder if any rally would have enough fuel to go anywhere meaningful.
Technical Indicators & Key Levels
If you’re tracking the charts, there are a few important price levels to keep an eye on. The nearest hurdle sits right around 0.0000011108—that’s the pivot just above where we are now. If buyers can push through that level with some decent volume behind them, the door opens toward that 200-day moving average. But let’s be real—that’s still a long way off and would need some serious momentum. On the flip side, the first real support is down around 0.0000010000, and if that breaks, we could see another drop toward the recent lows near 0.0000006302 USDT, where the price took a beating before.
The momentum indicators are sending mixed messages right now. The MACD looks cautiously optimistic in the short term, but the RSI is just hanging out in neutral territory around 50-55. That doesn’t give much cushion before things could turn bearish again if selling picks up. The shorter-term moving averages (7-day and 30-day) have been broken during recent sell-offs, so getting back above those would be a good first step toward changing the mood. There’s also a Fibonacci level worth watching at 0.0000010834 USDT—holding above that might steady the ship, but falling through could trigger another wave down.
Volume & Supply Transparency
Here’s where things get a bit concerning. Trading volume has been shrinking, which makes any price bump feel shaky without real buyer conviction backing it up. Then there’s the supply question. While the total supply is listed at 210 trillion APEPE tokens, there’s been some confusion about how many are actually circulating and how they’re distributed. The team apparently asked for updated supply numbers late last year, which would help clear things up if they follow through. Until that happens, the uncertainty around inflation or token dumps can weigh on the price, especially when the broader market gets nervous.
Price Prediction Scenarios
Based on what the charts and indicators are telling us, there are really two paths forward over the next few weeks:
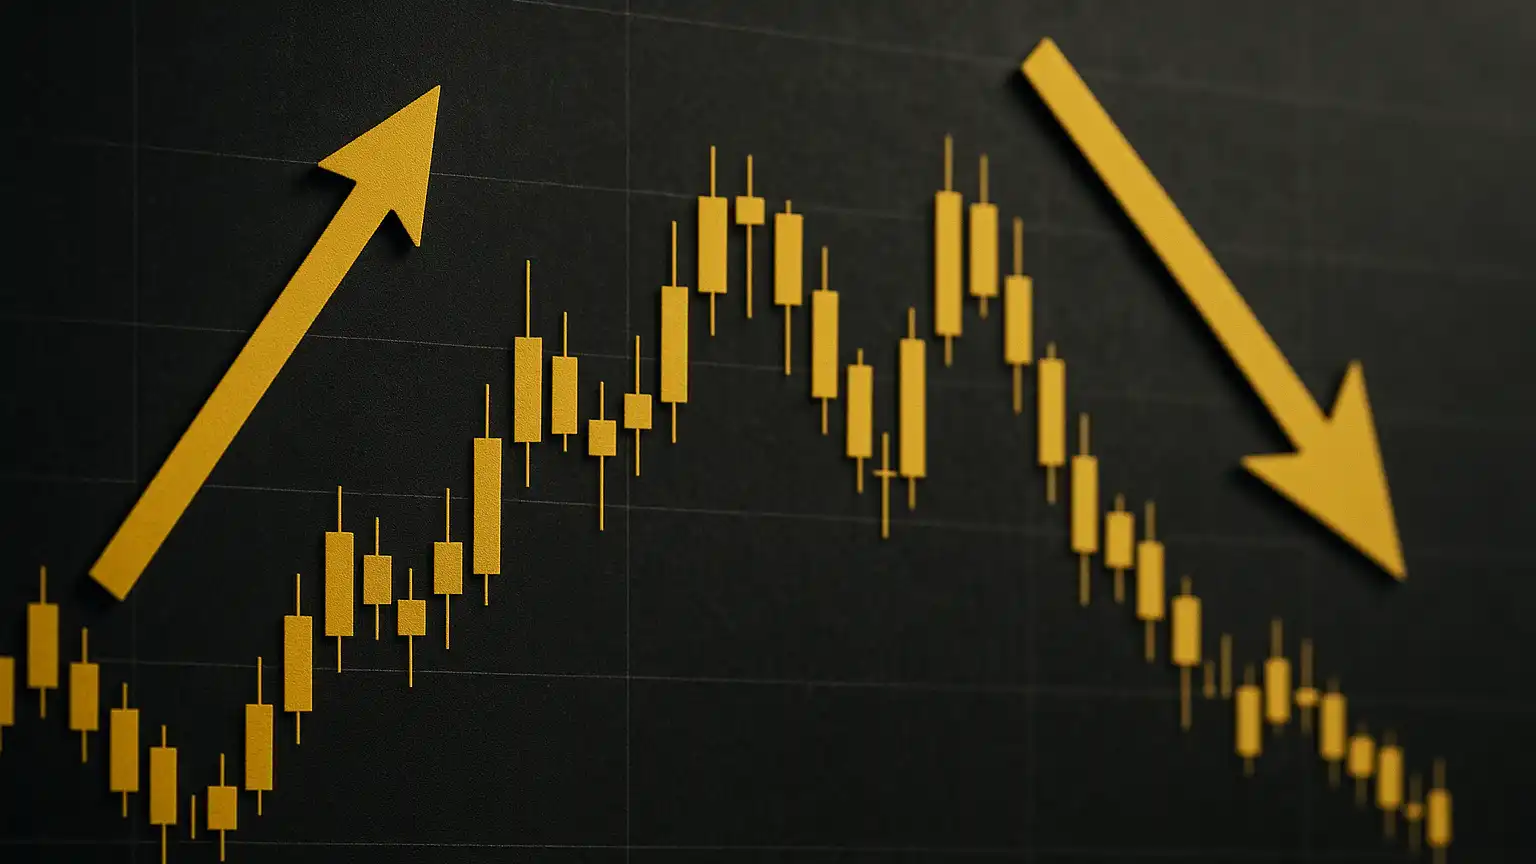
- Bearish continuation: If APEPE can’t break above that resistance around 0.0000011108 USDT, we’re probably looking at a drift down to test support near 0.0000010000. If that level gives way, the next stop could be those recent lows around 0.0000006302 USDT, especially if meme coins keep rotating out of favor or the broader market takes a hit. This would mean the downtrend just keeps going, and swing traders would likely lose interest.
- Short-term bounce / reversal attempt: On the other hand, if something sparks renewed interest—maybe a new exchange listing, some social media buzz, or clarity on that supply issue—the price could reclaim those short-term moving averages and test resistance in the 0.0000012000-0.0000013000 range. But to really break out of this bearish pattern, the price needs to hold above both the pivot (around 0.0000011108) and that Fibonacci level (around 0.0000010834), and it needs volume to back it up. Without that, any rallies will probably fizzle out pretty quickly when they hit resistance.
Either way, this is a risky play. The bigger trend is still bearish since the price remains stuck below that 200-day moving average, and a lot of people who bought in earlier are underwater on their positions. For anyone thinking long-term, getting back to the upside is going to take either a fresh story that gets people excited again, or some real changes like new utility, partnerships, or better transparency around the token supply.