Recent Developments and Market Sentiment
Notcoin has been making some interesting moves lately, rolling out new features that could genuinely boost demand for the token. They’ve introduced “Explore-to-Earn,” which basically pays you in $NOT for checking out games and apps on Telegram. They’ve also added Visa payment support, letting users spend their crypto while each transaction helps buy back tokens from the market. Plus, you can now use NOT as collateral for DeFi lending through CoinRabbit. These are all solid developments that give the token more practical use cases. That said, the market hasn’t been all sunshine and rainbows. We’re seeing some technical resistance, traders taking profits after recent gains, and a noticeable drop in active addresses and overall ecosystem buzz. The overall vibe? Cautiously optimistic, but definitely not euphoric.
Technical Indicators & Price Structure
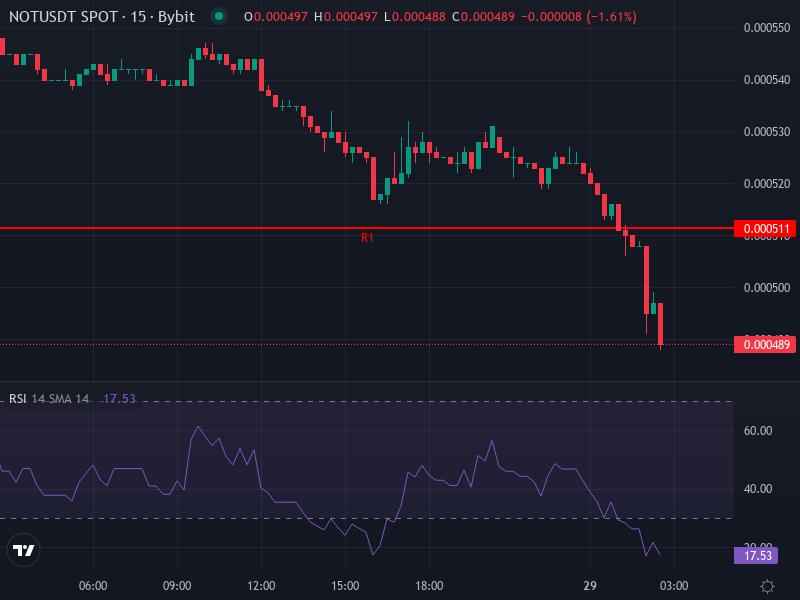
Right now, NOT/USDT is trading around $0.0004899, which represents a pretty brutal 24-hour drop of about 10.14%. Let’s break down what the charts are telling us on the 4-hour timeframe:
- RSI(4h): 26.84 — This is seriously oversold territory. When RSI drops below 30, it usually means sellers are running out of steam and we might see a bounce soon. The daily RSI sits around 44.6, which is more neutral but shows the longer-term bearish pressure is easing off a bit.
- MACD (4h): negative histogram — The MACD is sitting below its signal line with the histogram showing increasing bearish momentum. Not a great sign for the immediate future.
- Moving Averages: Both the 4-hour SMA and EMA are above the current price (around $0.0005415 and $0.0005388), acting as resistance walls. Daily resistance points are at $0.0005113 and $0.0005346, while support levels sit at approximately $0.0004763 and $0.0004647.
- Volatility & Trend Strength — The ATR is showing elevated volatility, meaning there’s higher risk right now. The ADX indicates a strong trend, but unfortunately it’s pointing downward. In thin markets, panic selling could easily push prices below support.
Price Prediction Scenarios Based on Chart Structure
Bullish Case: Reversal Setup
If NOT manages to hold steady above the $0.000476–0.000490 support zone, and considering how oversold the RSI is, we could definitely see a bounce. The first target would be resistance around $0.0005113, with a potential push toward $0.0005346–0.000556 if momentum builds. Breaking above those 4-hour moving averages would be a solid confirmation that bulls are back in control. If we see sustained buying volume, there’s an outside chance we could test $0.000600 in the short term.
Bearish Case: Downside Risk
On the flip side, if that support level breaks, things could get ugly fast. We’d likely see a drop toward $0.0004647 or even $0.000440. With the MACD showing bearish momentum and resistance stacking up above, this isn’t out of the question. If we break below $0.000440, we could revisit some older consolidation zones from previous weeks. Especially concerning if we keep seeing declining on-chain activity alongside selling pressure.
Key Levels to Watch & Trader Considerations
Here are the critical price zones you should keep your eyes on:
- Support Zones: ~$0.0004763, ~$0.0004646, ~$0.0004413
- Resistance Zones: ~$0.0005113, ~$0.0005346, ~$0.000556
- Indicator Triggers: Watch for the MACD histogram to start showing less negative values, and for RSI on the 4-hour chart to climb back above 30. These would signal buyers are stepping back in.
- Volume & Ecosystem Signals: Keep track of on-chain activity, Telegram ecosystem engagement, DeFi usage stats (especially that collateral feature), and any partnership announcements. These have historically sparked significant price movements.
Summary Insight
Notcoin is in a bit of a rough patch right now, consolidating after some sharp losses. We’ve got clear resistance overhead and oversold conditions suggesting a potential bounce, but nothing’s guaranteed. The most likely scenario is a short-term rebound if support holds firm, though we’d need some real catalysts to see sustained upside from here. If ecosystem activity keeps dropping or we can’t break through those resistance levels, there’s definitely room for more downside toward those lower support zones. Bottom line? Stay cautious. Wait for confirmation—like price closing above those daily pivot points and moving averages, or a pickup in actual platform usage. Right now, the outlook is somewhere between neutral and slightly bearish until we get a clearer signal one way or the other.