Introduction: Utility, Listings, and Current Price Pressure
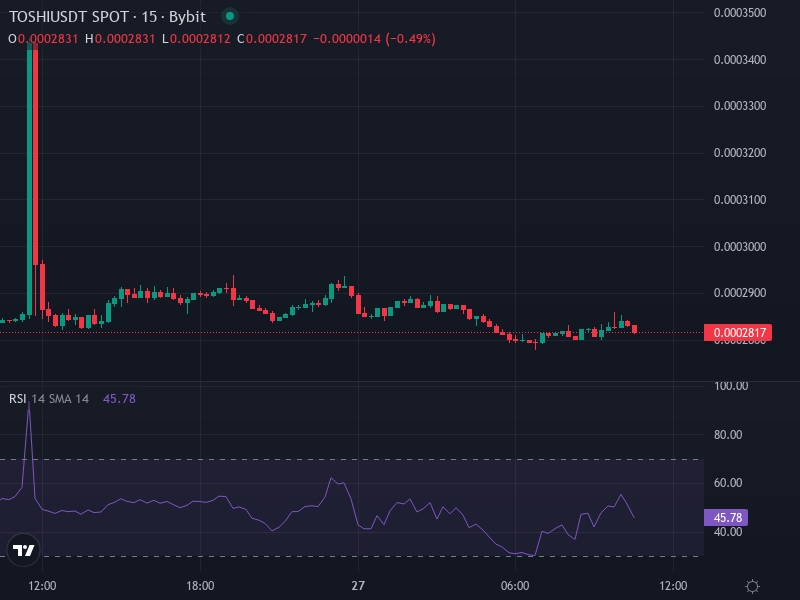
TOSHI, a memecoin running on the Base blockchain, has been going through a rough patch lately. Right now, it’s trading at around $0.00028207, down about 0.51% over the last 24 hours.
Over the past few months, TOSHI has managed to grab some attention thanks to a few interesting developments. The big one was getting listed on major exchanges like Upbit, which sparked rallies of over 40%. There’s also been buzz about more exchange listings coming, plus some actual real-world use cases starting to roll out—like “Toshi Mobile” through a partnership with World Mobile. Despite the price staying relatively flat, we’re seeing some interesting on-chain activity. New wallet holders now control more than 31% of the circulating supply, and exchange reserves are noticeably dropping.
The vibe in the market is pretty mixed right now. The community’s still excited and engaged, but when you look at the charts and technical indicators, things are starting to look a bit tired. If sentiment shifts or we get hit by some macro headwinds, TOSHI could be in for a more significant drop.
Technical Indicators & Price Prediction: Resistance, Support, and Momentum Readings
Looking at the recent technical picture, things are leaning bearish. All the moving averages—from the short-term MA5 all the way to the long-term MA200—are flashing sell signals, with price sitting below these key levels. The RSI is hanging around 30–35, which shows weak momentum without being completely oversold yet. Other indicators like Williams %R and Stochastic RSI are pointing to oversold or nearly oversold territory.
When we look at support and resistance levels, the nearest resistance sits around $0.0002936, with tougher barriers at $0.0003054 and $0.0003152. For support, there’s a floor around $0.0002720, then another at $0.0002622, with what looks like a solid foundation near $0.0002503.
Price Forecast Scenarios
Bearish Base Case: If TOSHI can’t push through that resistance around $0.0002936, we’ll probably see it test the support at $0.0002720. Break below that, and we could be looking at a slide down to the $0.0002500 area—especially if the broader crypto market takes a turn or if short-term holders start dumping their bags.
Bullish Disruption Potential: Now, if TOSHI manages to flip its short-term moving averages and close solidly above $0.0003054 with decent volume backing it, we could see a push toward $0.0003150. A real breakout above $0.0003152 might open things up for a more aggressive move—potentially aiming for resistance closer to $0.0003500 if everything lines up right.
Neutral / Consolidation Outcome: Honestly, the most realistic scenario given where things stand is more sideways action between resistance around $0.000305 and support near $0.000262. The steady accumulation from new wallets might keep the floor intact while also preventing any big upward moves until we get a clear catalyst.
What Traders and Investors Should Watch Next
Here’s what you should be keeping an eye on: any sudden spikes in trading volume when price tests resistance; continued drops in how much supply exchanges are holding; on-chain data showing long-term holders accumulating; macro events like regulatory news; and shifts in overall sentiment through social media buzz or rotation into other memecoins.
On the risk side, liquidity is still pretty thin outside of hype-driven moments. TOSHI is also vulnerable to broader market selloffs. And let’s be real—those utility projects like the mobile rollout and Toshi Mart might take way longer to actually move the needle on price than a lot of people are expecting.