Macro Trends & Catalysts
Dogecoin is currently trading at around $0.12194 USDT, down roughly 1.47% over the past 24 hours. Some interesting institutional moves are helping shape where DOGE might be headed. The launch of Grayscale’s Dogecoin Trust and a DOGE-focused ETF (DOJE) signal that regulators are starting to take the memecoin more seriously, which could bring in more mainstream investors. That said, whether this actually translates to price gains depends heavily on the broader crypto market—particularly Bitcoin’s performance—along with interest rates and regulatory developments. On the flip side, large wallet holders (whales) have been distributing their holdings, and retail sentiment remains mixed, which creates some real headwinds in the short term.
Technical Indicators & Chart Structures
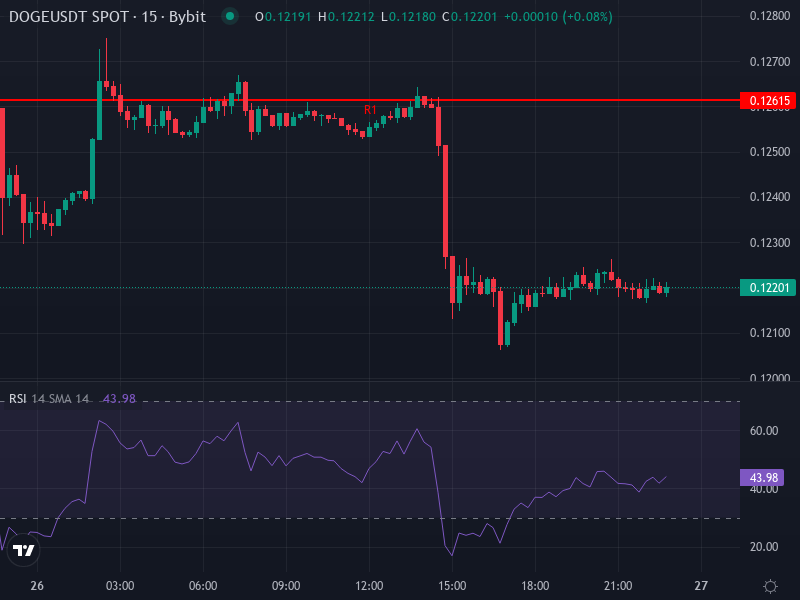
When you look at the 4-hour charts, things are looking pretty bearish right now. The Relative Strength Index (RSI) has dropped to around 32, which puts it in oversold territory but still shows strong selling pressure. The MACD is also negative (sitting below the signal line), confirming that sellers are in control for now. Both the simple moving average (SMA at roughly $0.12836) and exponential moving average (EMA at about $0.12721) are sitting above the current price, acting as resistance if DOGE tries to bounce back.
Support is clustered in the $0.12 to $0.14 range. If you zoom out to longer timeframes, this area lines up with some important technical levels—the bottom of the monthly Ichimoku Cloud, weekly consolidation zones, and a rising trendline that’s held up during past pullbacks. Above current prices, there’s a wall of resistance between $0.14 and $0.16, where previous consolidation and moving averages create a tough barrier. Breaking through that zone would need some serious buying momentum.
Short-Term Forecast & Scenarios
Bull Case: If DOGE can hold above $0.12 and push back above those 4-hour moving averages (around $0.127 to $0.130), we could see a relief rally toward $0.14 or even $0.15. For this to happen, you’d want to see strong buying volume and the RSI showing positive divergence (making higher lows while price makes lower lows). If bulls can punch through that $0.14–$0.16 resistance zone, there’s a shot at reaching $0.18 in the medium term.
Bear Case: If the $0.12 support fails to hold, we’re likely looking at another leg down toward $0.10. This becomes more likely if the overall crypto market weakens, whales keep selling, or Bitcoin takes a dive. Below $0.10, the technical supports get pretty thin, and price could slide quickly if there isn’t enough buying interest to absorb the selling pressure.
Technical Data Inputs Applied
• 4-hour RSI at roughly 32 shows oversold conditions with potential selling exhaustion.
• 4-hour MACD is negative, confirming downward momentum remains intact.
• SMA4h (around $0.12836) and EMA4h (around $0.12721) are both acting as overhead resistance.
• Daily pivot levels show major resistance at $0.13027 and $0.13303, with support at $0.11927 and $0.11651.
• Daily rate of change is negative, with price down about 7.4% over the period.
Risk Metrics & Watchpoints
Keep a close eye on volume during any bounce attempts. Without solid volume backing up the move, rallies tend to fizzle out quickly. Bitcoin’s price action is also critical—DOGE tends to follow BTC’s lead, so if Bitcoin weakens, expect DOGE to follow suit. Regulatory news matters too, especially anything related to memecoin ETFs or new listing rules, since that can shift sentiment fast. Finally, watch what the whales are doing. If mid-to-large holders keep dumping their coins, it’s going to be tough for institutional or retail buyers to absorb all that supply.
Estimated Trajectories
In a bullish scenario—where support holds, institutional money flows in, and the broader market cooperates—DOGE could climb back toward $0.14 to $0.16 over the next few weeks. A stronger breakout could even target $0.18, though that’s the optimistic case. On the bearish side, if support breaks or macro conditions deteriorate, we’re looking at a test of $0.10 to $0.11, with potential downside toward $0.08 if selling really accelerates and the crypto market broadly declines.