Market Fundamentals & Recent Catalysts
Pudgy Penguins’ token, PENGU, has been going through some rough patches lately. That said, the project has been making some real noise with mainstream partnerships and hitting solid milestones—their mobile game “Pudgy Party” just blew past one million downloads worldwide, and they’ve locked in licensing deals with companies like Schleich and nostalgic brands like Care Bears, which is helping them build out their physical product presence. They’ve even partnered with the NHL for the 2026 Winter Classic, which is pretty cool for reaching people outside the usual crypto crowd. All of this is actually boosting the token’s utility and giving the brand more credibility—something that matters when the hype starts to fade.
But here’s the thing: despite all these positives, PENGU’s price has taken a beating. Over the past few weeks, the token has mirrored the weakness we’re seeing across speculative assets in general. News drops and volume spikes tend to get followed by quick selloffs. So we’ve got this interesting mix of genuine adoption happening alongside investor exhaustion, which makes the outlook kind of a mixed bag.
Technical Indicator Snapshot & Price Structure
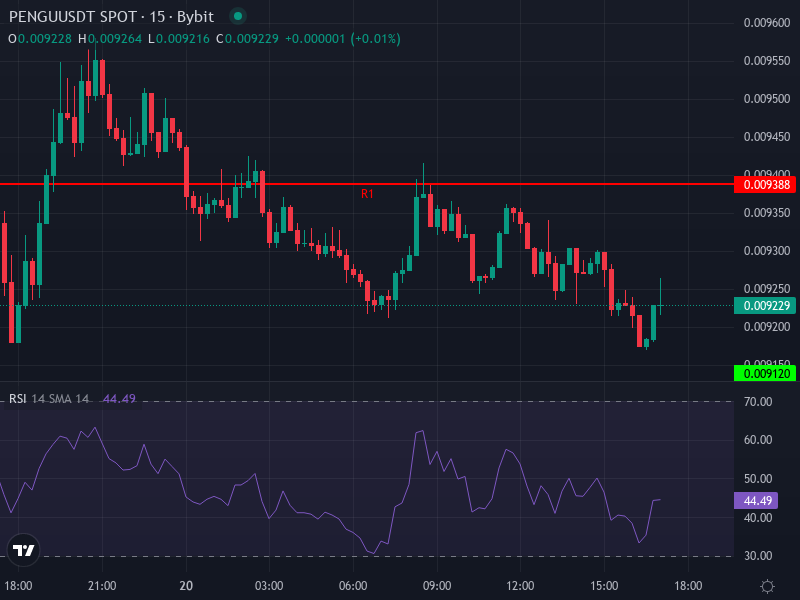
Right now, PENGU is sitting at around 0.00925 USDT, down roughly 1.36% today. Looking at the 4-hour chart, the Relative Strength Index (RSI) is hanging around 42.5—not quite oversold, but definitely below the neutral midpoint—which tells us sellers are still in control, though buyers might be starting to step in. The 4-hour MACD is showing some green shoots too, with the histogram turning slightly positive as the MACD line creeps up toward the signal line, hinting that the bearish pressure might be easing up a bit. The simple moving average (SMA) is currently above price at about 0.00953 USDT, and the exponential moving average (EMA) is even higher at roughly 0.00958 USDT, so both of those are acting as overhead resistance right now.
Key Support & Resistance Zones
If we look at the daily pivot points, resistance levels are clustering around 0.0093877–0.0096557 USDT (R1–R3), with the pivot itself at about 0.0092793 USDT, and support zones sitting between 0.0090113–0.0088517 USDT (S2–S3). On the 4-hour timeframe, resistance is bunched up around that SMA/EMA zone (~0.00953–0.00958), while support is closer to 0.00900 USDT—and if that breaks, we’re probably looking at a retest of the 0.00885 USDT area. These levels really matter—bulls need to push through and close above resistance to change the story, while bears could drive things lower if those support zones give way.
Short-Term & Intermediate Price Projections
Given where things stand technically and the outside pressures we’re seeing, there are a few different ways this could play out—and it really depends on which support or resistance zones hold:
- Bullish Base Case: If buying pressure comes back—maybe from positive liquidity news, another partnership announcement, or just less selling—PENGU could push back toward around 0.00950 USDT. If it manages to break cleanly above that level, we could see it head toward the 0.00965+ range, which lines up with those daily pivot resistance levels (R2–R3).
- Bearish Downside Scenario: If we can’t break through resistance, things could get worse. The next real support is between 0.00901 and 0.00885 USDT. If that doesn’t hold, price might drift down to 0.00850 or even lower, potentially triggering stop losses and bringing in more sellers looking to catch oversold RSI bounces.
- Neutral Scenario: Given what the indicators are showing, we could just see some sideways action for a bit. Price might bounce around between roughly 0.00900 and 0.00950 USDT while volume stays steady, creating a range-bound situation until something bigger happens to shake things up.
Momentum Drivers & Risks
A few things will really determine whether PENGU turns bullish or keeps sliding:
- Volume & Accumulation: On-chain data showing accumulation—like whales buying in, or less supply sitting on exchanges—could flip the narrative. People will be watching momentum indicators like the MACD crossing its signal line and whether on-balance volume (OBV) starts climbing.
- Macro Sentiment & Speculation: How people feel about NFT projects in general, the regulatory environment (especially around IP licensing), and whether retail traders stay interested in these mascot-style crypto projects will all play a role. But if broader risk assets weaken or there’s negative news around IP deals, that could weigh on PENGU.
- Technical Confirmation: A clean breakout above that SMA/EMA resistance zone (~0.00950–0.00960) with solid volume would shift momentum to the bulls. On the flip side, breaking below key support without much buy-side volume would tilt things bearish.
Price Prediction Ranges
Putting together the technicals, fundamentals, and overall sentiment, here’s what we might expect:
- Near-Term (1-2 weeks): Probably trading in a range of about 0.00900 to 0.00950 USDT. More likely to stay below resistance unless we get some bullish news.
- Medium-Term (1-2 months): If we get bullish confirmation, we could be looking at a move toward 0.00980–0.01020 USDT. If the bearish scenario plays out instead, we might see a drop toward 0.00850–0.00800 USDT.
- Longer Window (3-4 months): On the upside, if conditions line up right, we could see a push toward 0.01050–0.01100 USDT. Without a catalyst though, there’s a risk of consolidating lower around 0.00750–0.00800 USDT.