Recent Developments and Market Mood
PEPE has been making waves lately thanks to some interesting institutional moves and partnership news. When a big financial player suggested even a small allocation to crypto, PEPE shot up roughly 19% along with other altcoins—pretty clear sign that traditional finance is starting to pay attention. There’s also been talk of a new partnership with a platform on the BNB Chain, which should help with faster transactions and getting the community more involved. That said, it’s not all sunshine—technical analysts have spotted a bearish head-and-shoulders pattern, which could spell trouble if PEPE can’t push through key resistance levels. The drop in futures open interest isn’t exactly encouraging either, suggesting traders aren’t as confident about continued gains as they were before.
Core Technical Indicators & Key Levels
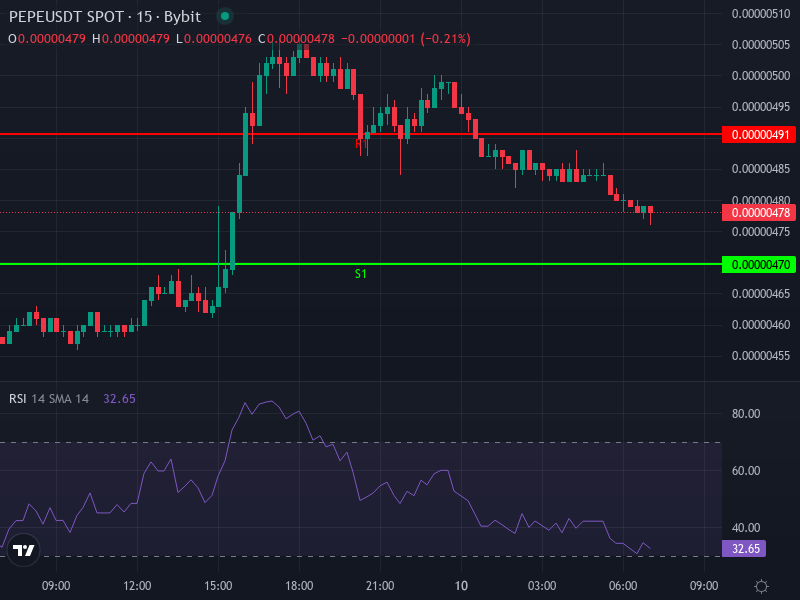
Right now, PEPE is trading at roughly $0.00000478 USDT, up a solid 4.41% over the past 24 hours. Looking at the 4-hour chart, the RSI is hovering around 54.14—slightly bullish territory without being overbought yet, so there’s potentially some room to climb. The MACD just flipped bullish with a crossover above the signal line, though the histogram bars are pretty small, meaning the momentum isn’t exactly explosive. The 4-hour SMA sits at about $0.0000045967, with the EMA a touch higher at $0.0000046712. Both are trailing below the current price, which supports the idea of a short-term uptrend.
On the daily chart, pivot analysis shows resistance levels between $0.0000050433 and $0.0000051167, with support stretching down to around $0.0000044867. The daily rate of change is sitting positive at about 5.07%, backing up the recent bullish momentum. Whether PEPE can hold these levels or break through resistance will be crucial for what comes next.
Scenarios & Price Predictions
Bullish Breakout Path
If PEPE manages to punch through that $0.00000504–$0.00000512 resistance zone with conviction, we could be looking at a move toward $0.0000060–$0.0000065 in the coming weeks. Getting there would probably need some serious whale accumulation or strong inflows to keep things moving smoothly. As long as the price holds above the EMA and RSI stays in neutral-to-bullish range, the uptrend could stick around. If everything lines up perfectly, PEPE might even test $0.0000070–$0.0000080 over the next month or two.
Bearish / Risk Case
On the flip side, if PEPE gets rejected at resistance or suddenly reverses, we could see it slide back toward daily support around $0.00000470–$0.00000450. If the momentum dies out or broader market conditions turn sour, PEPE might revisit the lower end of its recent trading range. A break below S1 at roughly $0.0000046967 could trigger more selling, potentially pushing prices down to the S2 or S3 pivot levels. Watch for RSI dropping below 50 or the MACD flattening out—those would be red flags that the bulls are losing steam.
Chart Reference
Trader Takeaways & Risk Control
For traders comfortable with risk, the current price looks fairly attractive given how close we are to those short-term moving averages—just make sure you’ve got tight stop losses set below daily support. The risk-reward setup gets a lot better if PEPE can break and hold above $0.0000050. If you’re more cautious, it might be worth waiting for a confirmed breakout above resistance or seeing sustained support at pivot levels before jumping in. And let’s be real—memecoins are wild, so proper position sizing and having a clear exit plan aren’t just important, they’re essential.