## Recent Market Developments and Context
Right now, MEME is trading at around **$0.001203**, up about **2.22%** over the last 24 hours. The token has been making some noise recently with new exchange listings—like the one on Bitkub—and some token unlock events that have definitely gotten traders’ attention. These kinds of events usually shake things up, bringing in fresh liquidity while also potentially adding sell pressure to the mix. Earlier in November, we saw a pretty significant unlock worth $5.15 million, which was roughly 5% of the total supply earmarked for airdrops. That probably contributed to some of the recent price dips as all that new supply hit the market. Like most meme coins, MEME lives and dies by speculation and momentum rather than any traditional fundamentals—it’s really all about the vibe and whether traders are feeling risky.
## Key Technical Signals and Current Trend
Looking at the 4-hour chart for MEME/USDT, the Relative Strength Index (RSI) is sitting at about 52.9, which is pretty much neutral territory—neither overheated nor oversold. The 4-hour MACD is showing a slightly bullish picture: the MACD line is above its signal line, though the histogram is fairly modest at around 0.00000497. This suggests there’s some mild bullish momentum building, but it’s not exactly screaming just yet. The current price is hanging out just above the 4-hour simple moving average (roughly $0.0011916) and really close to the exponential moving average (about $0.0011961), which tells us we’re in a consolidation phase right above some key support levels.
## Support/Resistance Levels & Price Projections
When we look at the daily pivot levels, we can map out some clear zones to watch. On the resistance side, we’ve got **R1 at about $0.0012273**, **R2 around $0.0012497**, and **R3 near $0.0012843**. For support, we’re looking at **S1 at approximately $0.0011703**, **S2 around $0.0011357**, and **S3 at about $0.0011133**. The central pivot sits at roughly **$0.0011927**.
The fact that the price is holding just above the daily pivot and sitting near those short-term moving averages gives us a couple of potential scenarios to consider:
– If the buyers step up and push the price above R1 (around $0.001227), we could see momentum carry MEME toward R2—maybe hitting the $0.001250-$0.001280 range over the next few trading sessions, assuming the volume comes along for the ride.
– On the flip side, if sellers take control and push below S1 (roughly $0.001170), we might see a slide toward S2 (about $0.001135), and possibly even S3 ($0.001113) if things get really negative.
It’s worth noting that while many short-term oscillators are showing bullish signals, the longer-term moving averages (MA50, MA100, MA200) are still sitting above the current price, which creates some overhead resistance and hints at a more cautious longer-term picture.
## Projected Price Path: Near-to-Mid Term
Given what the indicators are telling us, along with those pivot zones and the recent unlock activity, here’s how things could play out:
### Bullish Case
If accumulation picks back up and buying volume starts to increase, MEME could push toward that $0.001227 resistance level first. From there, we might see a move toward $0.001250. If the bulls can sustain a break above $0.001250, the path opens up toward $0.001280-$0.001300. Of course, this all depends on the broader meme coin market staying strong and any positive catalysts like new exchange listings or actual utility announcements.
### Bearish Case
If momentum fizzles out, we could easily see MEME drop below $0.001170. Breaking below that level would increase the risk of falling toward $0.001135. Push below that, and $0.001113 becomes the next logical stopping point. Weak trading volume or additional token unlocks could definitely accelerate any downward movement.
## Short-Term Chart Indicators and Visual Support
The 4-hour MACD histogram ticking into positive territory, combined with price action holding above those short-term SMAs, hints at a mildly bullish bias in the immediate term. This is pretty typical of consolidation phases that happen right before a breakout. That said, those longer-term moving averages sitting above current price levels act as resistance zones that will need some serious bullish energy to break through.
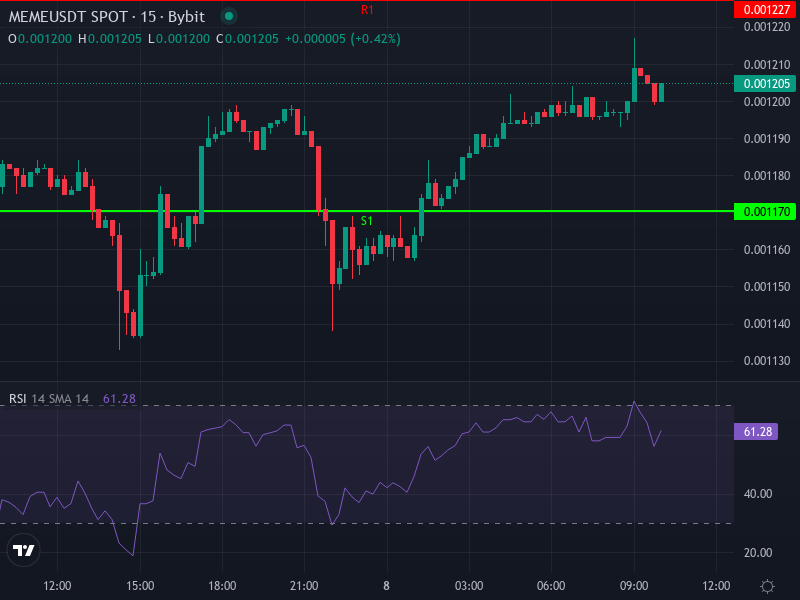
This chart shows MEME’s recent trading range pretty clearly: you can see the peaks near resistance (around $0.00128), the support boundaries down near $0.00111-$0.00113, and those MACD crossovers that are forming but haven’t quite confirmed a momentum shift yet. That RSI hovering around the midpoint shows we’re on neutral ground, with the potential to tip bullish if volume starts picking up.
## Concluding Insight
MEME is basically sitting at a crossroads right now. Holding just above that daily pivot and the 4-hour SMAs suggests there’s support underneath, but those resistance levels near $0.00125-$0.00128 are clearly defined boundaries. A break above those resistance zones with solid volume could signal a decent short-term move higher. But if we don’t get that volume, or if more supply unlocks hit or broader market sentiment turns sour, we could easily see price drift down into those support zones around $0.00111-$0.00113. Keep an eye on volume spikes, daily closes above resistance, or any bearish breakdowns below support—those will be your best signals for which direction this thing is headed next.