Current Market Snapshot & Recent Developments
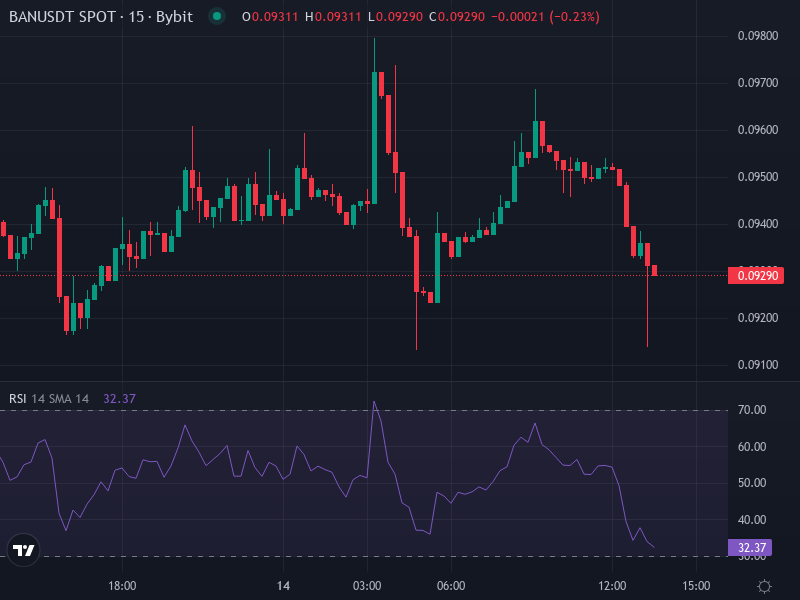
Right now, the Comedian token (BAN) is sitting at around $0.09293, down about −1.00% in the last 24 hours. It’s a pretty small drop, honestly. What’s interesting is that CMC AI reports show BAN behaving exactly like you’d expect a meme coin to—wild swings up when social media gets excited, then things cool down again. Not too long ago, BAN was trading between $0.076 and $0.080, so the current price shows there’s been some decent buying interest and positive sentiment pushing it higher. Trading volume has been all over the place, and technical indicators like RSI and MACD were looking pretty neutral or even slightly bearish in recent checks, which means we should probably be careful here. (These numbers are from late January 2026.)
There’s been some real action on the exchanges lately—BAN shot up as much as 80% after Binance announced they’d be listing a perpetual futures contract for it. That tells us there’s serious interest in trading this thing with leverage. The chart shows resistance levels being reinforced by where the moving averages are sitting and where price struggled before, while support seems to be holding around previous low points. Overall market sentiment? Somewhere between “meh, let’s wait and see” and “slightly worried,” especially when the broader crypto market gets shaky or money starts rotating between different altcoins.
Technical Indicator-Driven Price Prospects
Support, Resistance & Trend Analysis
Looking at the chart, BAN’s got support hanging around that $0.076–$0.080 area. That zone has held up as a bottom before and lines up with Fibonacci levels too. On the flip side, resistance is probably waiting around $0.095–$0.100—price has tried to break through there multiple times but just couldn’t hold above it. The moving averages on the longer timeframes (like the daily and 4-hour charts) are sitting slightly above where we are now, which basically means there’s some pressure from above keeping things contained.
Momentum Indicators & Oscillators
The RSI is pretty much in the middle ground right now—not overbought, not oversold, just kind of hanging out there without giving us much direction. The MACD has been showing weak bearish signals or just flat-lining lately, which suggests momentum is pretty sluggish. And here’s something worth noting: the volume indicators aren’t really showing that people are accumulating and building positions. A lot of those recent price jumps happened without the volume backing them up, which usually means they won’t stick around for long.
Short-to-Medium Term Price Scenarios
• If things go well: BAN could push through that $0.095–$0.100 resistance if volume picks up, and from there we might see it head toward $0.110–$0.125 over the next few weeks. But this would probably need something to spark it—maybe a new wave of social media hype or the broader altcoin market catching a bid.
• If things turn south: Losing that $0.076–$0.080 support level could get ugly fast, potentially sending BAN down to somewhere between $0.050 and $0.060. This becomes more likely if the overall crypto market turns risk-off or if traders start moving their money out of speculative meme coins into safer plays.
Risk Factors & Strategic Considerations
Let’s be real—meme coin dynamics are what drive everything here. That means you can make money fast, but you can lose it just as quickly. Sentiment and social media buzz matter way more than they should. BAN doesn’t really have solid fundamentals or utility backing it up, which makes it extra vulnerable to things like market shocks, exchanges adding or removing it, and changes in retail trader interest. Plus, liquidity isn’t always great, which just makes the price swings even wilder.
If you’re trading this: definitely use tight stop-losses near those support levels, and don’t get too crazy with leverage unless you’ve got confirmation the move is real. If you’re holding long-term and hoping for gains: keep an eye out for zones where smart money might be accumulating, watch for changes in trading volume, and look for signs that resistance levels are actually being tested with real conviction behind them.
Forecast Summary
With BAN trading around $0.09293 right now, we’ll probably see it bounce around between $0.080 and $0.100 in the near term. If it manages to break above $0.100, there’s a decent shot at reaching $0.110-$0.125. On the other hand, dropping below $0.076 could send it tumbling toward $0.060. The momentum indicators aren’t giving us much to work with—they’re pretty neutral. Bottom line: manage your risk carefully as this thing moves around.