Market Background and Fundamentals
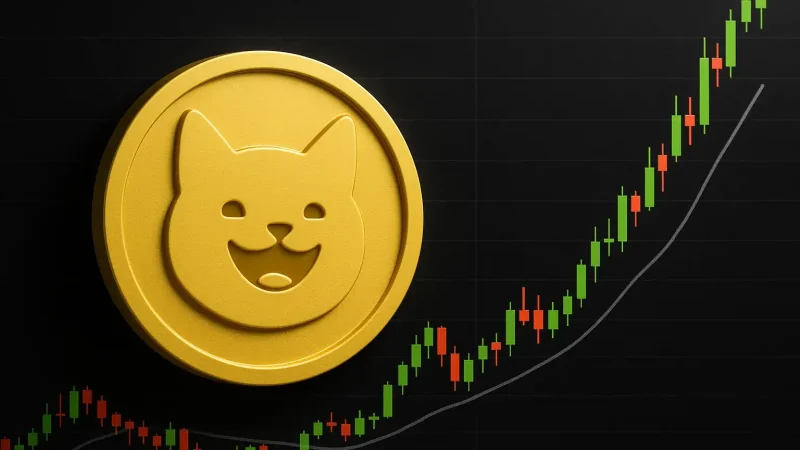
YZY Money is a memecoin connected to Kanye West (Ye) that runs on the Solana blockchain. It burst onto the crypto scene with a lot of hype and wild price swings. The token launched in August 2025 promising real-world utility like the Ye Pay payment processor and a YZY Card somewhere down the line. But things got messy pretty quickly. The big issue? About 70% of all tokens are controlled by Yeezy Investments LLC, locked up with multi-month vesting schedules. On top of that, there have been serious accusations of insider trading—with early retail investors getting burned while a few wallets made huge profits. All of this has turned YZY into an extremely speculative asset where the risks are all over the place.
Right now, YZY is trading around $0.33 to $0.34 USD. There are roughly 300 million tokens in circulation out of a total maximum supply of about 1 billion. Market cap has shrunk down to approximately $100 million, and trading volume is pretty low. What this means is that YZY is a highly volatile token with thin liquidity. Price movements are mostly driven by sentiment, sudden liquidity shifts, and what insiders or big wallet holders decide to do—not so much by real fundamentals or broader market trends.
Technical Indicator Analysis and Key Levels
Looking at the charts, YZY appears oversold in the short term. The 14-day RSI is sitting around 29, which usually signals a buying opportunity, and the Stochastic RSI is basically at zero—another sign that things might be oversold. That said, most momentum and trend indicators like MACD, ADX, and Williams %R are stuck in neutral territory. This tells us that neither buyers nor sellers have strong conviction right now.
Support levels to watch are around $0.3538, $0.3490, and a more solid floor at $0.3456, based on recent price action and pivot points. On the resistance side, you’re looking at barriers near $0.3620, $0.3654, and a tougher ceiling around $0.3702. Basically, the price is stuck in a tight range between $0.345 and $0.370, and it’ll probably bounce around there unless we see a surge in volume.
Trend Analysis: Moving Averages & Momentum Bias
The short-term trend is still bearish. YZY is trading below most of its key moving averages, and momentum indicators aren’t showing much strength on the upside. There’s no clear bullish crossover happening yet. Unless the token breaks decisively above its 50-day or 200-day moving average, expect the downward pressure to continue. On the flip side, if it manages to push above $0.3702 with strong volume, sentiment could shift and bring in momentum traders looking for a bounce.
Price Prediction Scenarios
Bullish Case: If YZY holds support between $0.3456 and $0.3538 and starts to reverse on higher volume, we could see it test resistance around $0.3620 to $0.3702. A clean break above that range—backed by positive news or rising momentum—might push the price toward $0.380 to $0.400 over the next month or two. For this to happen, you’d want to see the MACD turn positive, RSI climb above 50, and trading volume pick up.
Bearish Case: If support at $0.3456 breaks, the next level to watch is probably around $0.320 to $0.300, where buyers have stepped in before. Given how little liquidity YZY has and how much of the supply is controlled by insiders, any negative news—like a token unlock, regulatory pressure, or a big sell-off—could send the price down to those levels pretty fast. Expect major volatility if sentiment sours.
Neutral/Stagnant Case: Without a strong catalyst, the most likely scenario is that YZY just drifts sideways between $0.345 and $0.370 for a few weeks. Bulls and bears will wait for something decisive to happen, and indicators will stay flat. You might see occasional spikes based on social media buzz, something Kanye says, or broader crypto trends like developments on Solana or new regulations.