Recent Catalysts and Market Context for TOSHI
TOSHI, a meme-coin built on the Base blockchain, has been turning heads lately after landing a major listing on Upbit, one of South Korea’s biggest crypto exchanges. The addition of TOSHI/USDT and TOSHI/KRW trading pairs sent the price rocketing over 40% in short order, pushing its market cap north of $361 million and vaulting it past other meme tokens like MOG and REKT. Beyond the immediate price action, the listing has reignited conversations about TOSHI’s place in the Base ecosystem and whether the project can evolve beyond just meme status. There’s been some interesting movement on-chain too—exchange balances are dropping, which usually means people are moving coins into private wallets for the long haul. Meanwhile, whales appear to be positioning themselves near key resistance levels around $0.00043 to $0.00045.
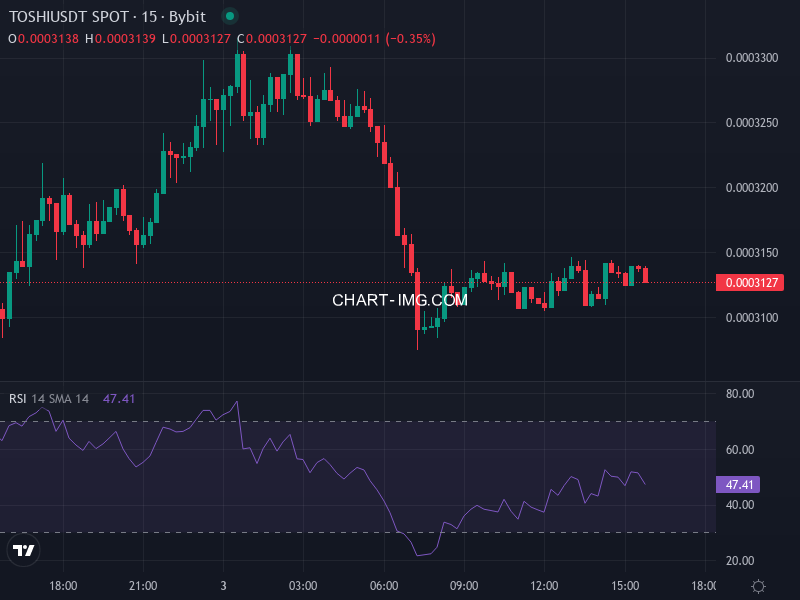
Right now, TOSHI is sitting at roughly 0.000313700854805 USDT, up about **+1.25%** over the last 24 hours. The technical picture is a bit of a mixed bag: most moving averages are pointing upward, suggesting bullish momentum, but several oscillators are flashing warnings that things might be getting a bit overheated or at least cooling off.
Technical Setup: Support, Resistance, and Indicator Signals
Support zones: The closest safety net sits around $0.0002903, with stronger floors at $0.0002846 and $0.0002739. These levels line up with recent daily lows and consolidation areas where buyers have consistently stepped in before.
Resistance zones: On the upside, the first ceiling starts around $0.0003067, then steps up through $0.0003174 and $0.0003231. If TOSHI can punch through these barriers, we could see tests toward the $0.00040 or $0.00045 range where sellers have historically shown up in force.
Moving Averages: The shorter-term averages—5, 10, and 20-day—are all sitting comfortably below the current price, which is typically a good sign. But the longer-term averages, particularly the 100 and 200-day lines, are still hanging above price in some readings. This tells us that while the short-term trend looks healthy, the bigger picture isn’t quite bullish yet.
Oscillators and Momentum: The 14-day Relative Strength Index is hovering in neutral to slightly oversold territory around 31-32, leaving some room for upside movement without triggering alarm bells. The Stochastic RSI, though, is showing up as overbought in some snapshots. The MACD is showing a modest bullish crossover in certain timeframes but remains underwater in many analyses, suggesting momentum is trying to recover but isn’t quite firing on all cylinders yet. Volatility gauges like ADX and ATR indicate things are pretty jumpy right now, meaning any breakouts or breakdowns could happen fast and hard.
Short-Term Price Forecast Scenarios
Looking at the current setup, here’s how things might play out in the near term:
- Bullish scenario: If TOSHI can hold the line above $0.0002903 and break cleanly through $0.0003174, we could see a push toward the $0.00034-$0.00036 range. From there, the psychological $0.00040 level comes into play. Getting there would require solid volume and continued positive vibes around meme coins and the Base ecosystem in general.
- Range-bound / neutral scenario: Without a fresh catalyst or significant new money flowing in, TOSHI will probably just chop sideways between $0.0002739 and $0.0003174. This would mean plenty of back-and-forth as the price tests both ends of the range repeatedly. We might stay stuck in this pattern until something big happens—another exchange listing, Base ecosystem developments, or a new wave of meme coin mania.
- Bearish scenario: If that $0.0002739 support level gives way and large holders start dumping or stop-losses get triggered in a cascade, the price could tumble toward $0.00025 or lower. If the moving averages fail to hold as support, that weakness could accelerate the decline pretty quickly.
What to Watch: Catalysts and Risk Factors
Several things could really move the needle for TOSHI going forward. Big exchange listings, meaningful utility announcements within the Base ecosystem—think launchpads, NFT integrations, or governance features—and continued accumulation by holders moving coins off exchanges would all be positive. With meme coins especially, sentiment can shift on a dime and create outsized price swings in either direction.
On the flip side, those overbought readings we mentioned earlier could set up sharp corrections. We’ve already seen whale selling activity near the $0.00043-$0.00045 resistance zone. Broader crypto market risks—interest rate decisions, regulatory crackdowns—along with shifts in meme sector sentiment could also weigh on price. And let’s not forget that liquidity is still pretty thin compared to major tokens, so sudden outflows could amplify losses significantly.
All things considered, TOSHI is in an interesting spot: momentum is trying to build, but we’re right up against resistance with support levels that aren’t exactly rock solid. In the short term, sideways trading or modest gains seem more probable than a massive breakout—unless we get hit with a strong catalyst that changes the game.