Current Market Snapshot and Recent News
As we move into early January 2026, REKT/USDT is changing hands at roughly $0.0000003358. That’s a pretty brutal fall from its glory days—the token hit an all-time high around $0.000001413 back in August 2025, meaning we’re looking at over a 75% haircut from those peak levels.
That said, things aren’t completely bleak right now. In the last day alone, the token jumped nearly 8%, though zooming out to the weekly view shows it’s still nursing losses north of 4%. Monthly performance has been more of a sideways grind with slight downward drift—not catastrophic, but definitely not exciting either.
From a tokenomics perspective, REKT takes a purist approach: no premine, no private sale allocations, and everything is mined through proof-of-work with a halving mechanism and capped maximum supply. While this fixed supply structure could put a ceiling on long-term price action, it does mean there’s no ongoing dilution threat hanging over holders’ heads.
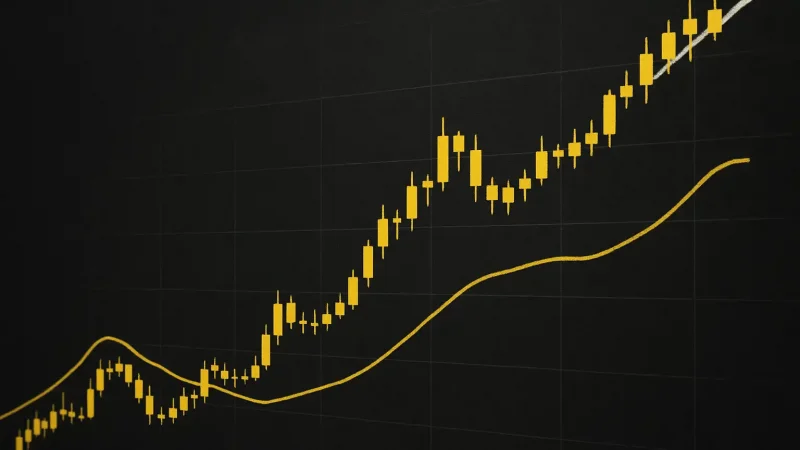
Technical Indicators and Trend Analysis
Looking at the technicals, we’re seeing pretty mixed signals with a slight bearish tilt. The Relative Strength Index is hanging out somewhere in the 40-50 zone—basically neutral territory. It’s not screaming oversold bargain, but it’s not flashing overbought warnings either.
Moving averages tell a similarly confusing story. Some shorter-term Simple Moving Averages like the 5-day and 10-day are sitting just above current price levels, while longer-term SMAs show price trading below them. Translation: we’re facing resistance at multiple timeframes, which isn’t great for bulls hoping for a quick turnaround.
Other momentum tools add more texture to the picture. The Stochastic RSI frequently shows overbought readings, Williams %R is all over the place, and the MACD is essentially flat or slightly negative in most timeframes. Bottom line: momentum is pretty anemic, and any upside attempts are likely to face headwinds.
Support, Resistance, and Volatility Zones
The key resistance zone worth watching sits around $0.00000035 to $0.00000040 USDT—just a hair above where we’re trading now. This area has rejected price previously and aligns with several longer-term moving averages. If REKT can punch through and hold above this level, the door opens toward $0.00000050, assuming momentum actually shows up.
On the flip side, support looks a bit mushier but appears to be clustered between $0.00000025 and $0.00000030. If we crack below that $0.00000025 level, things could get ugly fast, especially considering how unstable price action was in that range during mid-2025’s weaker periods.
Volatility remains the name of the game here. We’re not just talking about regular price swings—volume spikes and wild daily percentage moves suggest this is still very much a speculative playground rather than an accumulation phase.
Price Projection Scenarios
Given where the charts stand today, I’m sketching out two reasonable paths REKT could take over the next couple of months:
Bullish Reversal Scenario
If REKT can genuinely break above and hold the $0.00000040 to $0.00000045 resistance band—and crucially, do it on solid volume with confirming signals from MACD and RSI—then a move toward $0.00000060 becomes realistic over the next month or two. What would drive this? Positive community news, sustained buying interest, and a favorable environment across the broader altcoin space would all need to align.
In this scenario, you’d also see those short-term moving averages flip from resistance to support, which would validate the trend change. Fair warning though: this is the higher-risk bet since it assumes a complete momentum reversal without major obstacles emerging.
Bearish Continuation Scenario
On the other hand, if REKT can’t convincingly close above that $0.00000040 level, we’re probably looking at more sideways chop or a gradual slide toward the $0.00000025 support area. And if that support gives way? We could easily see price tumble back toward $0.00000020 or lower.
What supports this more pessimistic view? The MACD remaining flat or negative, RSI stuck below the 45-50 range, and moving averages continuing to cap any rallies. Volatility would likely remain elevated in this scenario too, meaning you’d get those classic head-fake moves—sharp drops followed by weak bounces that ultimately go nowhere.
Investor Considerations and Risk Factors
Let’s be real: as a meme-style token with minimal utility beyond speculative trading, REKT is extremely vulnerable to shifts in social media sentiment, broader crypto market cycles, and macro shocks like regulatory crackdowns or exchange delistings. The fixed supply and mining-based structure might protect against dilution, but they won’t save you from a liquidity crunch or panic selling.
Things to keep your eye on: any near-term catalysts from the community (announcements, new exchange listings, utility additions), volume patterns (rising volume on upside moves is bullish; volume spikes on downside moves could signal mass exits), and confirmation from technical indicators—think RSI pushing above 50, MACD crossovers, or price breaking through key moving averages. Without these confirmations, downside risk remains very real.