Recent Developments & Market Context
REKT, the meme token connected to Rekt Brands, has been grabbing attention lately—and not just because of its price movements. In mid-2025, the project hit a genuine milestone when Rekt Drinks sold its first million cans of sparkling water. It’s a real validation of their “cultural flywheel” strategy, showing there’s actual substance behind the hype. Around that same time, REKT launched on Binance Alpha with an airdrop and trading competition, which naturally brought a flood of short-term traders and community buzz—though let’s be honest, these events usually come with some serious sell pressure once people actually get their tokens. The bottom line? There’s definitely retail interest building, but that hasn’t translated into steady demand yet. Even with volume spikes and influencer shoutouts, REKT is still riding the wild meme token rollercoaster. The real-world products and retail presence are promising, but the technical picture tells a messier story.
Technical Indicator Analysis & Current Price Action
Right now, REKT/USDT is sitting at around 0.00000014507509955306403 USDT (or 1.45075 × 10⁻⁷ if you prefer scientific notation), down more than 2.4% in the last day. The technical indicators are painting a mostly bearish picture, though there are some oversold signals hinting we might see a small bounce or at least some stabilization soon.
Trend & Moving Averages: Looking at the daily chart, the price is trading below both its 50-day and 200-day exponential moving averages. That’s textbook downtrend territory. These moving averages have been acting like a ceiling, and until REKT can push through and close above them with conviction, it’s hard to see the bearish momentum letting up.
Oscillators & Momentum: The Relative Strength Index is hovering in the low 30s, which suggests oversold conditions—though it’s not screaming “extreme” just yet. The Commodity Channel Index is also showing oversold readings, meaning the recent selling might have gotten a bit overdone. That said, the MACD is sitting neutral, so there’s no clear reversal signal forming yet. The Average True Range is elevated, which tells us volatility is high and we should expect some big swings.
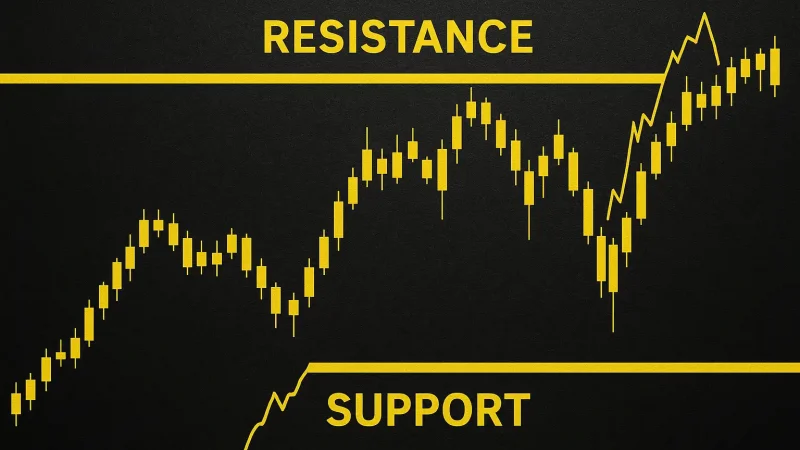
Support & Resistance Matrix: The key support zone sits around $0.0000001 to $0.00000015. If the price tries to rally, immediate resistance will show up near the 50-day EMA and some previous minor highs. There’s also a historically meaningful resistance level around $0.0000002. If we get any kind of bounce, expect sellers to show up in force at that level.
Price Prediction Scenarios Based on Technicals
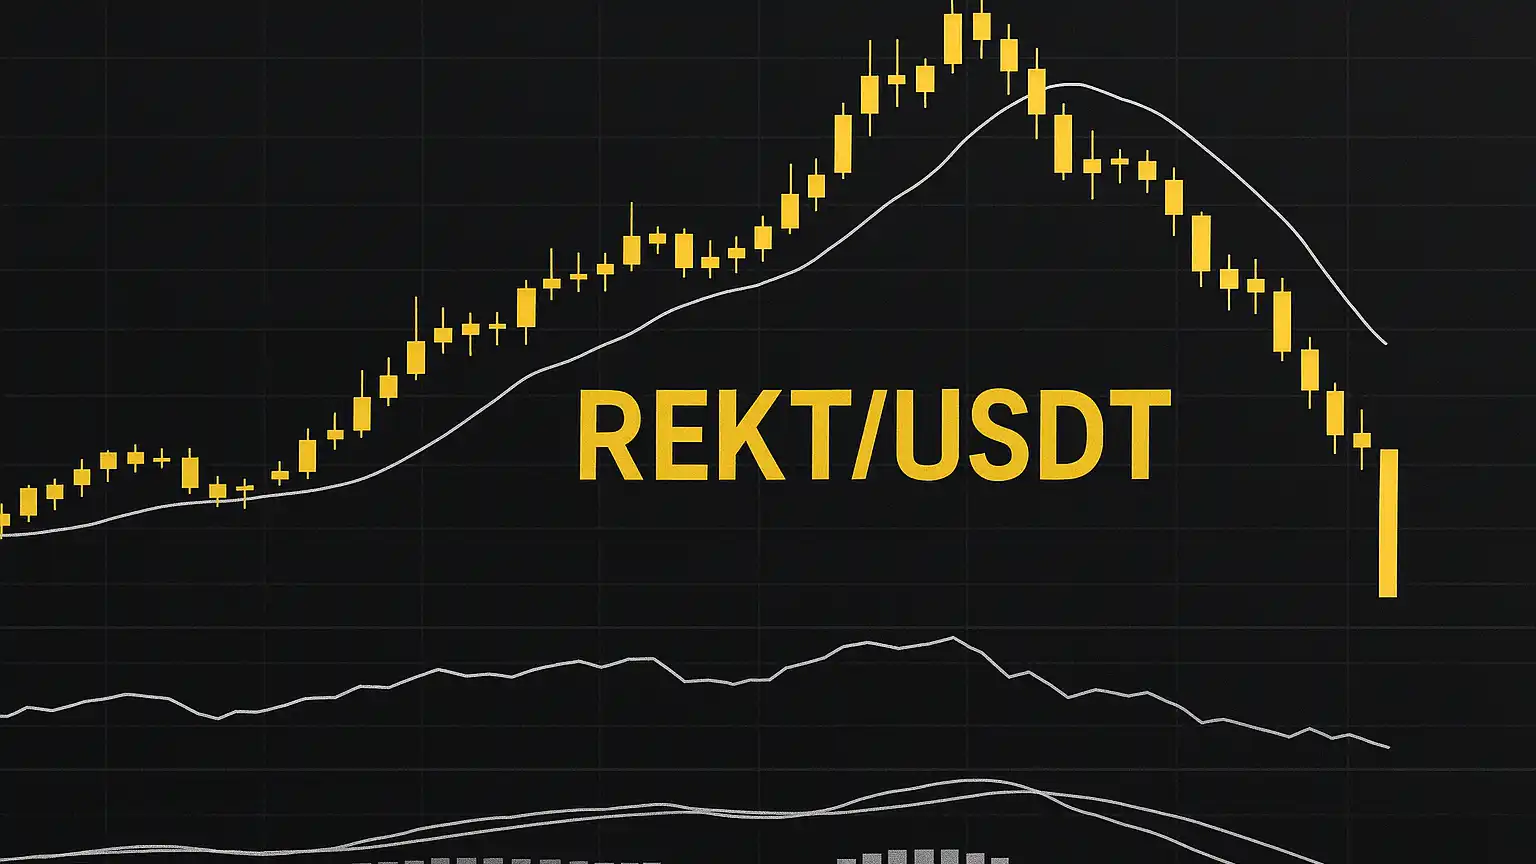
Bearish Continuation Scenario
If the selling keeps up—especially with the price staying below those key moving averages—REKT could slip back toward support in the $0.00000010-$0.00000012 range. Break below that, and we might see things get ugly, with the next stop around $9.0 × 10⁻⁸. Sure, those oversold oscillators might give us some quick relief rallies, but without real volume or a catalyst, those bounces tend to be short-lived. This scenario assumes the broader crypto market stays risk-off and meme coins continue their rotation struggles.
Moderate Reversal or Range-bound Scenario
If REKT catches a break—maybe from product launch hype, successful retail expansion, or just some good news—the token could make a run at retesting those moving averages. In that case, you’re looking at resistance around $0.00000015-$0.00000020. The price could end up bouncing around between current levels and that resistance band, creating a choppy range with moderate volatility. If indicators like the RSI or CCI climb back from oversold toward neutral territory, we could see a 20-50% rally from where we are now.
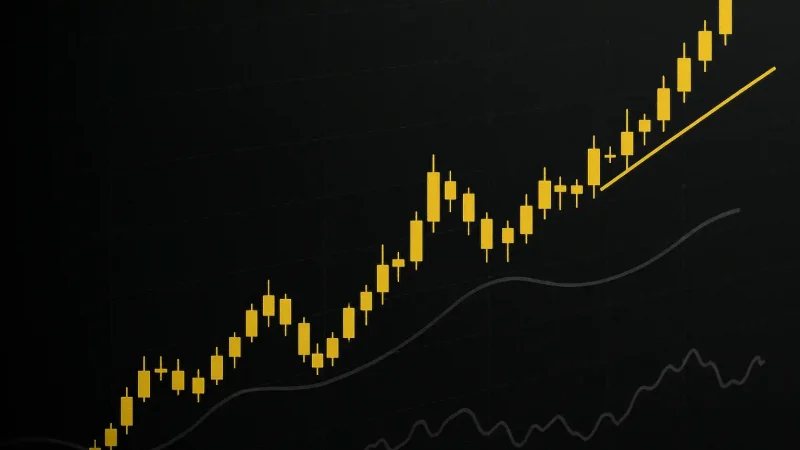
Bullish Breakout Scenario (Less Likely Without External Catalysts)
For a real bullish move to happen, REKT needs to not just touch but actually close above the 50-day EMA and hold above the 200-day EMA with solid volume backing it up. Beyond that, key resistance sits around $0.00000025-$0.00000030. A sustained breakout could push REKT into the $0.00000030-$0.00000040 zone over the medium term. But here’s the catch—this really depends on external triggers like major retail partnerships, massive consumer adoption, or a favorable shift in the broader crypto market. Without those kinds of catalysts, any bullish breakout probably won’t have legs.
Risk Factors & Key Catalysts to Watch
Risks include: Token supply inflation from airdrops creating sell pressure, macroeconomic headwinds hitting speculative assets, loss of community momentum, and the possibility that brand growth doesn’t actually translate into real token utility.
Catalysts to monitor: Expansion of real-world products (more retail placements beyond those limited 7-Eleven drops), successful partnerships in gaming or entertainment, new exchange listings, and any signs of increasing token demand beyond just speculation—like actual utility through rewards, staking, or governance features.
Target Price Forecasts
Here’s what we’re looking at for the next 1-3 months under each scenario:
- Bearish baseline: Could drop toward $0.00000010 if current support levels give way.
- Moderate consolidation: Likely range between $0.00000013 and $0.00000020.
- Optimistic breakout: Possible climb toward $0.00000030 with strong volume and positive fundamentals backing it.
Final Insight
From a technical standpoint, REKT is caught in a tough spot. The trend is clearly bearish, most longer-term indicators are flashing red, but at the same time, those oscillators are suggesting the downside might be getting stretched. What we’ve got here is a high-risk, potentially high-reward setup. Unless REKT gets some new catalysts to flip the script on this technical downtrend, the easier path is probably still downward. That said, for swing traders or speculators with an appetite for risk, these oversold levels could present entry opportunities—just make sure you’re disciplined with tight stop-losses and clear exit strategies.