Recent Context & Market Sentiment
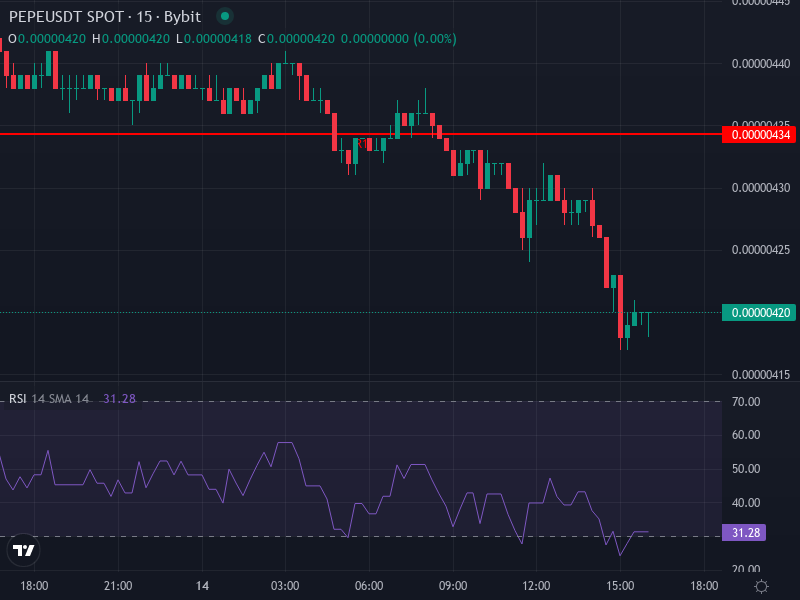
PEPE is currently hovering around $0.0000041944, having taken a hit with nearly a −4.90% decline in the past day.
While it’s still a crowd favorite in the meme coin space, the mood around PEPE has gotten complicated. Word on the street—and from on-chain sleuths—is that one whale controlled way too much of the initial supply, which has people nervous about centralization risks.
Add to that the fact that meme coins overall are seeing less hype than before. Speculative money just isn’t flowing like it used to, and right now the broader market seems to prefer safer, less volatile plays.
Even the altcoin season indicators look pretty weak, and if you check the Fear & Greed Index, it’s clear traders aren’t exactly rushing into high-risk tokens like PEPE.
So yeah, the community’s still loyal and active, but the fundamentals and market vibes? Not exactly screaming “moon.”
Technical Indicator Analysis
Looking at the 4-hour chart, PEPE’s Relative Strength Index (RSI) is sitting at around 32.20. That puts it in oversold territory—or at least close to it—which historically can signal a bounce is coming, even if it’s just a small relief rally.
The MACD tells a slightly different story. Both lines are in the red, and the histogram, while tiny, is leaning bearish. Translation: momentum’s still pointing downward, even if it’s not screaming.
What really stands out is that PEPE is trading noticeably below both its 4-hour Simple Moving Average at roughly $0.0000044923 and its Exponential Moving Average near $0.0000044381. When price is under both of those, it usually means the short-term trend isn’t in your favor.
If we shift to the daily pivot points, things get a bit more structured. The main pivot level (“P”) comes in at about $0.0000042567. Above that, you’ve got resistance zones at R1 (~$0.0000043433), R2 (~$0.0000044967), and R3 (~$0.0000045833).
On the downside, support is stacked at S1 around $0.0000041033, then S2 at $0.0000040167, and S3 down at $0.0000038633.
Oh, and the 1-day Rate of Change? It’s brutal—nearly −12.16%. That kind of drop shows PEPE’s been bleeding momentum fast over the last 24 hours.
Price Scenarios & Projections
So what happens next? Well, the oversold RSI does leave the door open for a bounce. If buyers show up, the first real test will be reclaiming that pivot zone around $0.0000042567. From there, R1 at $0.0000043433 becomes the next hurdle. A stronger rally—maybe fueled by a sudden surge in volume or some viral social media action—could push PEPE toward R2 ($0.0000044967) or even R3 ($0.0000045833). But let’s be real: without a catalyst or some broader market strength, those upper levels feel like a stretch right now.
On the flip side, if selling pressure keeps up, PEPE could easily slip down to S1 around $0.0000041033. Break below that, and we’re looking at S2 ($0.0000040167) or worse, S3 ($0.0000038633). Given that nasty 1-day rate of change, downside momentum is definitely alive and kicking. Anyone holding should probably consider having stop-losses staged below S1, just in case things get uglier.
Readying for a Reversal or Continued Decline?
Right now, PEPE feels like it’s stuck at a fork in the road. On one hand, that oversold RSI on the 4-hour chart could tempt some traders to scoop up what they see as a discount. On the other hand, price is still stuck below both the SMA and EMA, which means the bears haven’t really loosened their grip yet.
What happens next really depends on volume and sentiment. Are the whales going to step back in and start accumulating? Is there going to be some piece of news—an exchange listing, a viral moment, anything—that reignites interest? Without something like that, PEPE might just drift sideways or keep sliding toward those lower support zones.
Key Takeaways for Traders
If you’re thinking about jumping in, wait for confirmation. Look for a solid bounce above that pivot resistance around $0.0000042567, ideally with volume spiking and the MACD histogram starting to climb back up.
And if you’re already holding? Make sure you’ve got your stop-losses set—somewhere just below S1, or a bit lower if you’re planning to hold through short-term chop.
Zooming out a bit, over the next few days to weeks, if PEPE can fight its way back above those moving averages, there’s definitely room to test the higher resistance levels. But if it fails? We could be looking at a slide toward S2 or even S3. Stay sharp.