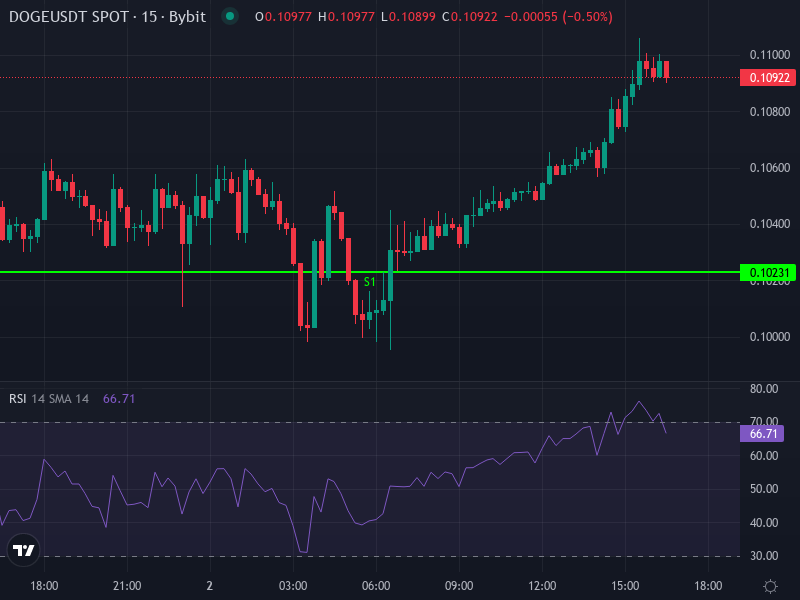
Current Price Action and Macro Noise
Right now, the Department Of Government Efficiency token (DOGE) is sitting at around US$0.10902, up roughly 4.5% in the last day. It’s a decent little bump that shows some short-term buying interest, but when you look at the bigger picture, the technicals are telling us this thing might just trade sideways unless we see a clear break above or below certain key levels. There’s also been chatter lately about regulators taking a closer look at meme coins, plus some general jitters around political risk factors. All of that could stir up more price swings. Keep in mind that while DOGE has a cult following and strong social buzz, there’s still plenty of sell pressure lurking—especially from whales who might dump if the headlines turn sour.
Key Technical Indicators and Structure
Let’s break down what the charts are showing us based on the latest 4-hour and daily timeframe data:
- 4-hour Relative Strength Index (RSI) is hanging around 47.7 – basically neutral territory. It’s not screaming oversold or overbought, but being under 50 does lean a bit toward the bears if selling picks up.
- MACD (4h): The histogram is barely in the green at about +0.00080, and the MACD line is sitting above the signal line. That said, both are still negative overall, which means we’ve got a weak bullish signal trying to form but not quite there yet.
- Moving Averages (4h): The 4-hour Simple MA is around $0.11152, and the Exponential MA is near $0.11074. Since the current price ($0.10902) is below both of these, we’ve got resistance sitting right above us.
- Pivot Levels (Daily):
- P (pivot): roughly $0.10644 – sitting just under where we are now, this is acting as nearby support.
- Resistance 1 (R1): about $0.11332 – this is the first real ceiling we need to crack through for any meaningful rally.
- Support 1 (S1): around $0.10231; Support 2 (S2): near $0.09543; these are your safety nets if things start rolling downhill.
- Resistance 3 (R3): up at $0.12433 – this is your moonshot target if the bulls really get going.
Trend Momentum vs Overhead Pressures
So here’s the deal: short-term momentum looks okay—that slightly positive MACD histogram and the little uptick we’ve seen suggest buyers are trying to step in. But the fact that price is stuck below both the 4-hour moving averages tells us there’s still plenty of resistance to chew through. Getting from $0.10902 up to that $0.1133 resistance zone is going to take real buying volume and probably some kind of positive news or partnership announcement. On the flip side, that pivot support at $0.1064 is absolutely crucial. If that breaks, we could easily see a slide down to $0.102 or even lower.
Price Projection Scenarios: Short & Mid-Term
Looking at what the indicators are saying, here are a few different ways this could play out, depending on what kind of catalysts hit and how the overall market is feeling about risk.
- Bullish Breakout Scenario: If DOGE manages to punch through that $0.1133 resistance with solid volume behind it, the next stop would be R2 around $0.1174, and if things really get cooking, we could see a push toward R3 near $0.1243. For this to work, though, we’d need to hold support above $0.1064 the whole way up—any dip below that could turn into a nasty fake-out.
- Range-bound Consolidation: There’s a decent chance DOGE just bounces between $0.1023 and $0.1133 for a while—could be days, could be weeks. Traders will keep testing those levels, and everyone will be waiting for some news to break the stalemate. That RSI sitting in the 40-50 range fits perfectly with this kind of sideways grind.
- Bearish Breakdown: If we lose that pivot support around $0.1064, things could get ugly fast. First stop would be S1 near $0.1023, and if that doesn’t hold, we’re looking at S2 around $0.0954. In this scenario, all that overhead resistance just makes it easier for sellers to pile on, potentially triggering a wave of stop-losses getting hit.
Implications for Traders and Key Triggers to Watch
If you’re trading this short-term, buying near the pivot or current price (around $0.109) could give you a decent setup, especially if you set your stops just below S1 (around $0.102) and aim for targets in that R1–R2 zone. Watch for volume spikes during the trading day or signs that big wallets are accumulating—that could signal a breakout is coming. For those holding longer-term, you’ll want to keep an eye on any news about tokenomics changes, upcoming upgrades, or high-profile endorsements that could shift the narrative.
The big things that could really change the game here include any regulatory moves targeting memecoins, broader macro news that affects crypto risk appetite (think interest rate decisions or inflation data), and shifts in social media sentiment—whether that’s governance news, branding partnerships, or cross-chain integrations that bring fresh money into the ecosystem.