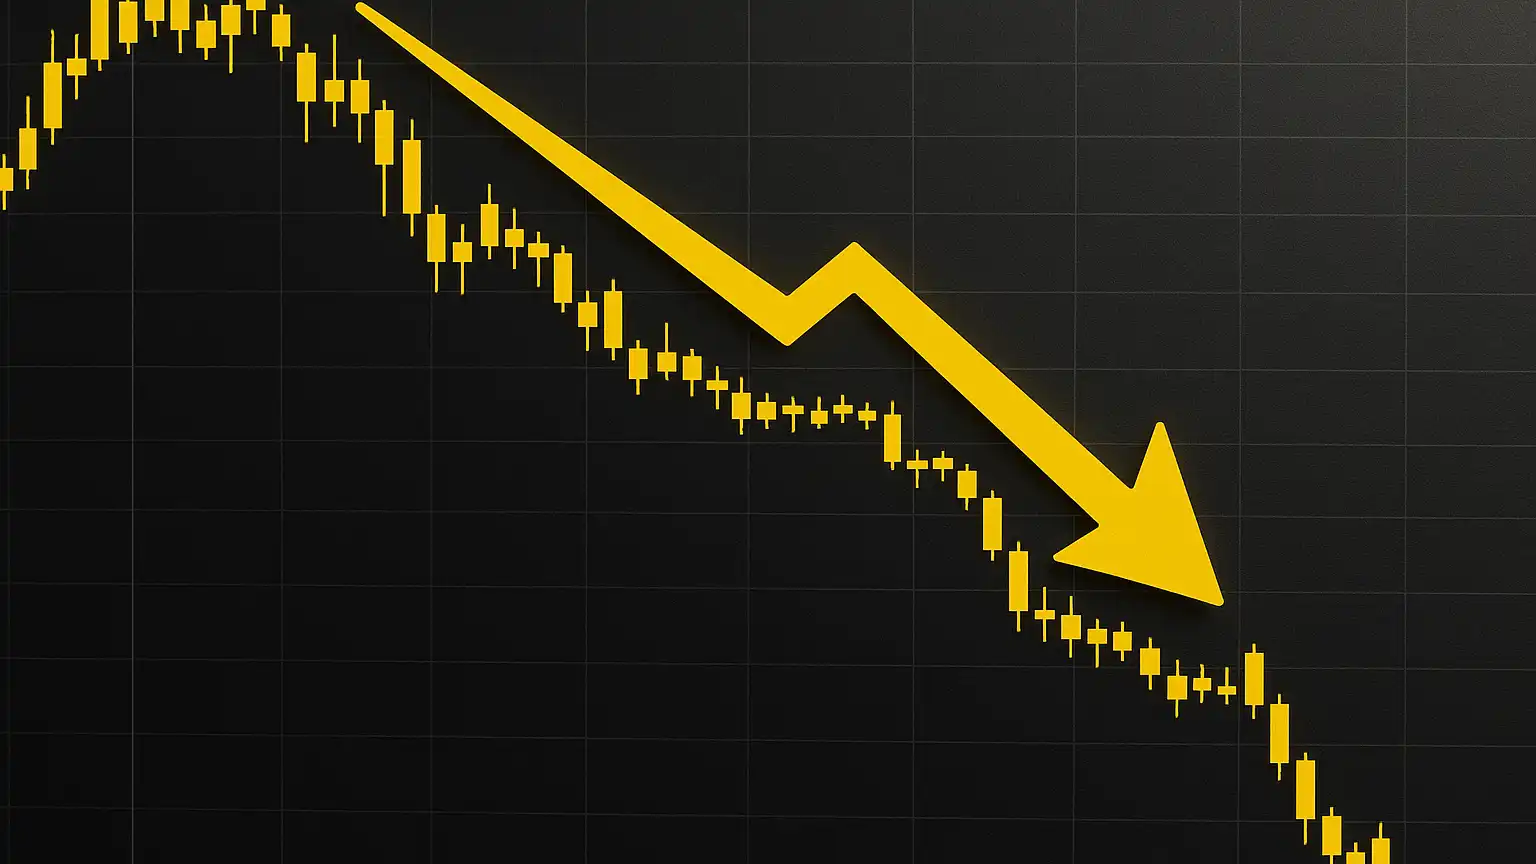
Current Market Overview
Rekt (REKT) is currently trading in the low-micros range—sitting somewhere around 0.00000024-0.00000026 USDT per token based on recent data. The token has taken a pretty serious hit over the last month, dropping roughly 35-40% against the dollar. Daily trading volume stays under $1 million, which tells us the market is pretty thin. When liquidity is this low, even relatively small buy or sell orders can push the price around significantly. With a circulating supply hovering around 420.69 trillion REKT tokens, there’s constant downward pressure whenever sellers show up without enough buyers to absorb it. Market sentiment indicators like the Fear & Greed Index are firmly in “Fear” territory—hanging in the high 20s to low 30s—which shows that investor confidence is pretty shaky right now.
Technical Indicators & Price Prediction
From a technical standpoint, things are looking mostly bearish or neutral at best. The 14-day Relative Strength Index is sitting in the mid-40s down to around 30, depending on which platform you check. That puts it near neutral or slightly oversold territory, which might hint at a short-term bounce, but there’s no real momentum behind it yet. Both the 50-day and 200-day simple moving averages are sitting above the current price, acting as resistance. This setup suggests that unless REKT can push above those moving averages and hold there, the downward trend is likely to continue.
Looking at the next few weeks, the forecast isn’t particularly encouraging. We’re probably looking at REKT testing the 0.00000022-0.00000024 USDT range, with a possibility of dropping into the 0.00000020-0.00000022 zone if selling picks up. On the upside, there’s resistance clustering around 0.00000026-0.00000030 that would need to be cleared before any meaningful rally could get going.
Over the next three to six months, projections show a pretty muted recovery at best. Even if the broader crypto market holds steady or improves, REKT will probably struggle to break above the 0.00000035-0.00000040 level without some kind of catalyst—think new exchange listings, significant partnerships, or changes to the token’s economic model. Without any positive developments, current models suggest we could see either sideways movement or further decline toward the 0.00000018-0.00000020 USDT range.
Key Support & Resistance Levels
Support Zones:
• Primary: ~0.00000020-0.00000022 USDT—this area has historically served as a floor and represents an important psychological level.
• Secondary: ~0.00000015-0.00000018 USDT—only comes into play if selling pressure really ramps up and buyers stay on the sidelines.
Resistance Zones:
• Near-term: ~0.00000026-0.00000030 USDT—this is where moving average resistance is concentrated.
• Critical breakpoint: ~0.00000035 USDT—breaking through here would require sustained volume and a real shift in market sentiment.
Factors That Could Alter the Forecast
There are several things that could change REKT’s trajectory, either for better or worse:
- Tokenomics & Supply Burn: If the project ramps up token burning or introduces new mechanisms to reduce circulating supply, that could help offset the downward pressure. Right now, the burn rate seems pretty small relative to the massive supply out there.
- Exchange Listings or Delistings: REKT was recently delisted from some trading venues, which hurt liquidity. Getting listed on bigger exchanges or returning to platforms it lost could provide a nice short-term boost through increased visibility and trading volume.
- Broader Market Conditions: Bitcoin’s dominance, overall appetite for altcoins, and macro factors like interest rates and regulatory news all play a role. REKT has been particularly sensitive to market-wide sell-offs and risk-averse behavior.
- Community and Branding Catalysts: Partnerships, real-world use cases, and social media buzz can create momentum. For meme-oriented tokens like REKT, narrative strength matters—but it’s pretty fragile without solid fundamentals backing it up.
Prediction Summary
Looking at the technical data, sentiment, and volume patterns, REKT is probably headed for some additional downside in the short term. We’re likely looking at a range around 0.00000020-0.00000024 USDT unless something changes. For the medium term—say three to six months out—there’s potential for a modest bounce, but it’s hard to see it pushing much above 0.00000040 USDT without real improvements in liquidity or some positive catalysts. Keep an eye on that 0.00000020 USDT support level and the 0.00000030 USDT resistance—those are the critical points that will tell us which direction things are heading next.