Latest News & Market-Wide Context
The meme-token TRUMP, which launched on Solana, continues to be one of the most politically controversial crypto assets out there. Recent reports show that a staggering 80% of the total supply sits in the hands of Trump-affiliated entities, and whenever large chunks of tokens get unlocked, the price tends to take a beating. We saw this play out in July and November 2025, when unlocks triggered drops of 22–30%. This kind of concentrated ownership creates serious downside risk unless we see a massive surge in buying demand.
On the regulatory front, things are heating up. There’s talk of new bills that would restrict political figures from endorsing cryptocurrencies and impose stricter oversight on tokens controlled by people with political connections. This regulatory uncertainty adds another layer of risk for anyone holding TRUMP.
At the same time, broader U.S. policy moves have been surprisingly crypto-friendly. Recent guidance allowing banks to serve as crypto intermediaries and the passage of the GENIUS Act suggest the current administration is warming up to digital assets. While this could lift overall crypto sentiment, TRUMP remains exposed to political backlash because of its obvious connections.
Bottom line: this token sits at the intersection of speculative excitement and real fundamental risks, and news can send it swinging dramatically in either direction.
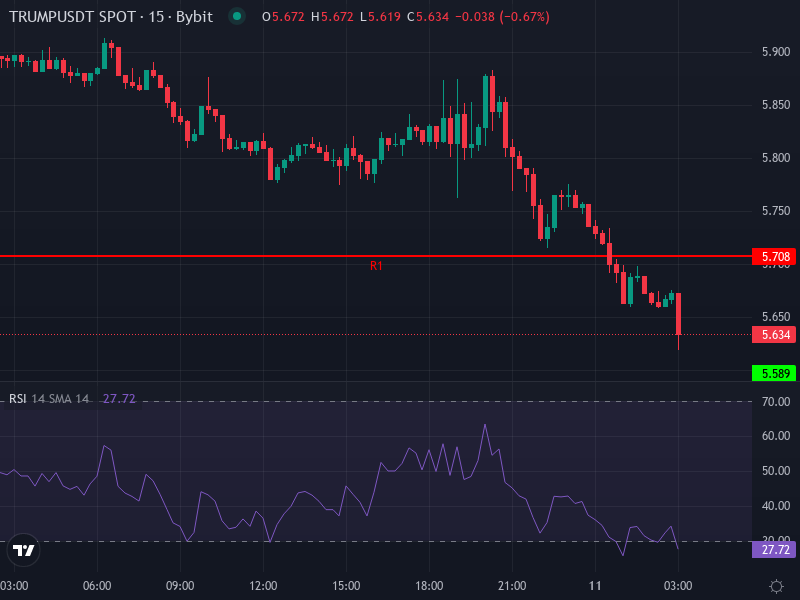
Technical Indicators & Price Structure
Right now, TRUMP is hovering around $5.6577, down about 3.96% over the last 24 hours. The technical indicators aren’t showing much strength, and there’s limited room for upside unless we break through some key levels.
Looking at the 4-hour chart:
• RSI sits at 38.37, below the neutral 50 mark, which suggests mild bearish pressure but nothing extreme yet.
• MACD is in negative territory: the MACD line (around -0.00678) is below the signal line (around -0.00111), with a negative histogram confirming weakening momentum.
• The 4-hour Simple Moving Average is around $5.7416, and the Exponential Moving Average is roughly $5.7860. Since the current price is just below these levels, there’s clear resistance in the $5.75-$5.80 range.
Daily pivot levels give us more reference points: the main pivot is at $5.6643, with resistance at R1 around $5.7077, R2 near $5.7833, and R3 at $5.8267. On the support side, we have S1 at roughly $5.5887, S2 at $5.5453, and S3 at $5.4697. These levels are useful for managing risk and spotting potential breakout opportunities.
Here’s the price chart to give you a visual sense of where things stand:
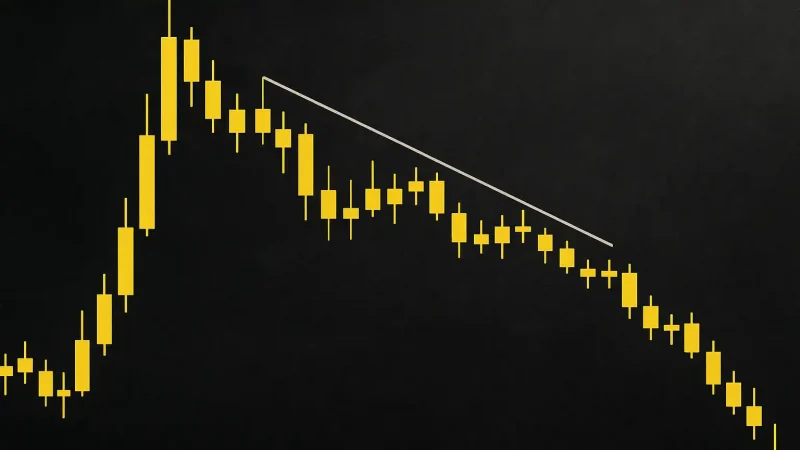
Support & Resistance in Focus
Support levels worth watching:
• The first support just below current prices sits around $5.56 (daily S1).
• Next down, we’ve got support near $5.46, with stronger support around $5.36 (S2/S3).
Resistance overhead:
• First hurdle is around $5.71 (R1).
• The key resistance zone is between $5.78–$5.80, where the R2 level and the 4-hour moving averages converge.
• Above that, stronger resistance waits near $5.83 (R3), which needs to be cleared before we can talk about any real bullish momentum.
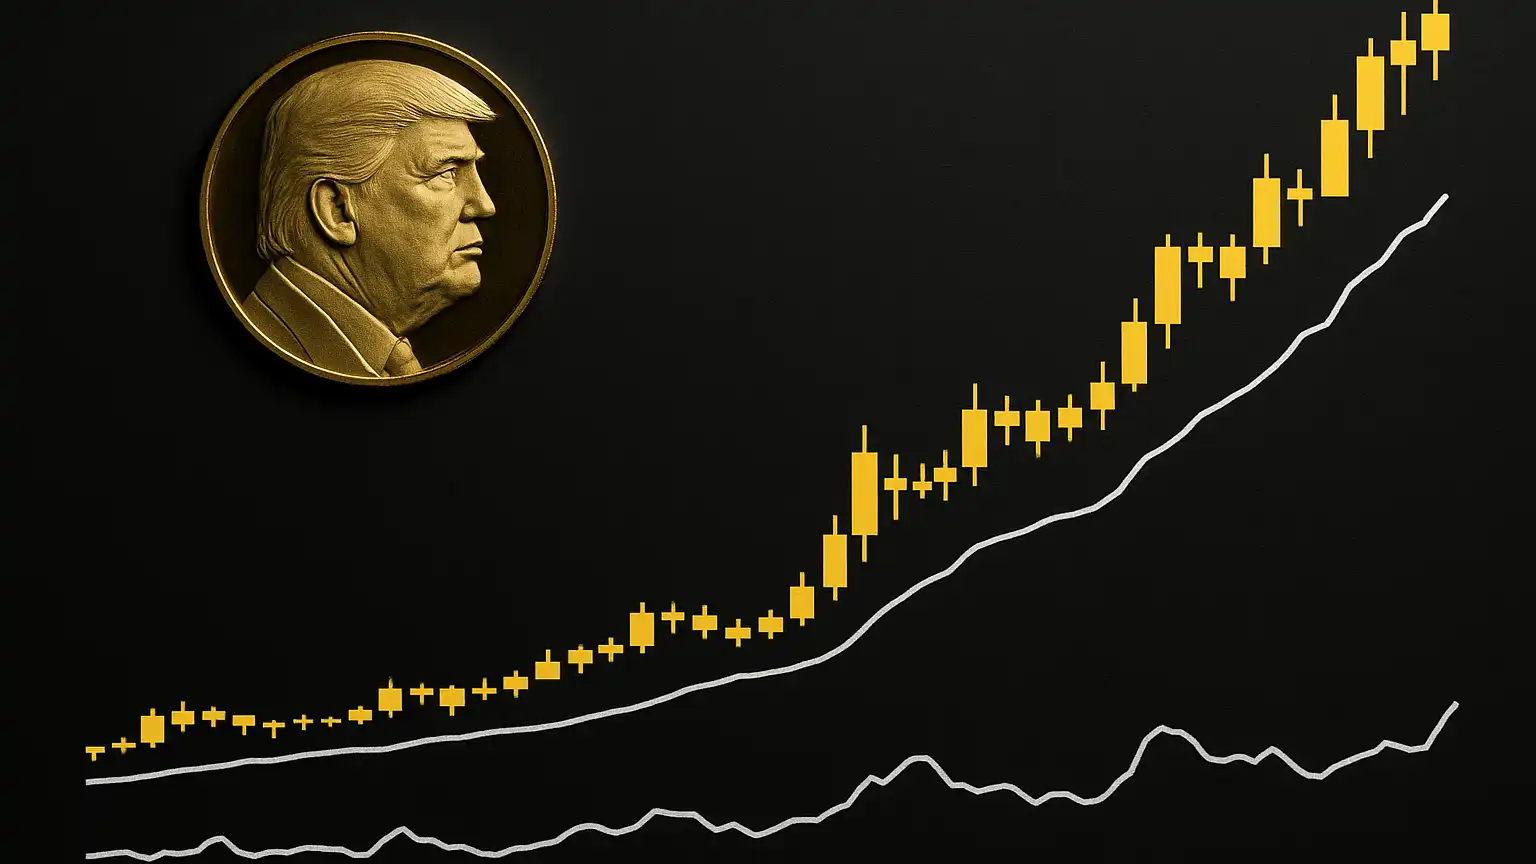
Price Forecast & Scenarios
Based on sentiment analysis, recent predictions, and what the charts are telling us, here are the likely scenarios for where TRUMP could be headed.
Bearish Outlook
If the current weakness continues and no strong positive catalyst emerges, TRUMP will probably test lower support levels. Some forecasts point toward a decline into the $4.00 to $5.00 range by early 2026, especially if we get hit with negative news like regulatory crackdowns or big token dumps from insiders. Several analysis sources are pointing to averages in that territory.
The threat of upcoming token unlocks is very real. Even a moderate release of tokens by the controlling entities could trigger sharp sell-offs, so keeping an eye on the tokenomics calendar is crucial.
Bullish Case
For the bulls to take control, we need to see a clean break above the $5.80 resistance zone, backed by strong volume and positive sentiment. This could come from favorable policy news or unexpected partnerships. If buyers can push through the $5.80–$5.85 range, TRUMP might rally toward $7–$10 in the near term, with more optimistic projections suggesting $9.50-$11.50 if the broader crypto market catches fire.
Looking further out into 2026 and beyond, if the token develops actual utility—maybe through DeFi integration or governance features—and survives the regulatory challenges, we could see prices stretch toward $12–$15. Of course, that comes with massive volatility and considerable risk.
Risk Factors & Key Variables
Where this goes from here depends on several critical factors:
• The token unlock schedule is huge. Supply releases from Trump-affiliated stakeholders will continue to create downside risk. Big, sudden unlocks without enough demand to absorb them can be devastating.
• Regulatory developments remain unpredictable. New legislation targeting meme-coins or politically-linked tokens could bring legal or reputational damage.
• Sentiment and speculation are the main drivers here. Without real use cases, the price is completely at the mercy of hype cycles.
• Technical levels like the $5.80–$5.85 resistance zone will be critical inflection points. Failing to break through tends to amplify downward pressure toward support.
• Broader market conditions matter too—overall crypto volatility, macroeconomic trends, and U.S. regulatory policy will all influence how much risk appetite exists for speculative tokens like this one.
Emergent Insights & Implications
TRUMP really embodies everything a meme token is—its value is driven by narrative, supply dynamics, and political branding rather than any real underlying utility. For traders, this means you need very short time horizons and tight risk management. If you’re holding positions without stop-losses somewhere in the $5.40–$5.60 range, you’re exposing yourself to significant downside.
Looking forward, if a credible use case or meaningful structural change actually materializes, TRUMP could potentially reclaim higher resistance levels and push into the $7-$10 range. Until that happens, the most realistic scenario is probably a period of sideways consolidation or gradual decline, particularly if we face bearish market conditions or more supply events.