Current Context & News Signals
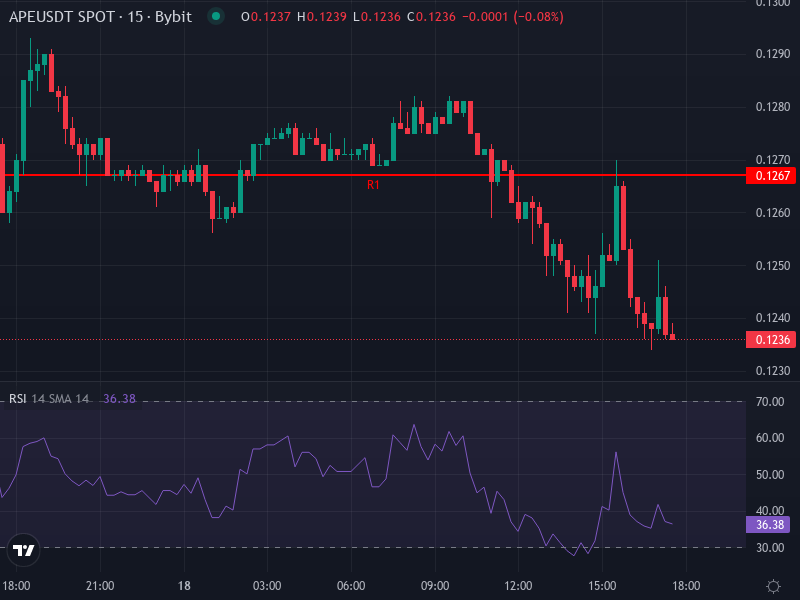
Right now, ApeCoin is hovering around 0.12374 USDT, which is down roughly 2.30% over the last 24 hours. Looking at the daily pivot points, we’re sitting just below the central pivot at around 0.12510. The first resistance zone (R1) is hanging out between **0.12670 and 0.13140**, while support levels are stacked below us at approximately 0.12200, 0.12040, and 0.11730.
On the news front, there’s quite a bit happening in the ApeCoin world. The team is actively pushing forward with Project R.A.I.D., which focuses on expanding cross-chain capabilities across platforms like Solana and BNB Chain. Worth noting too is the recent governance shake-up—ApeCoin DAO has shifted toward a more centralized structure under “ApeCo” following the passage of AIP-596. The goal here is supposedly to make decision-making and execution smoother and faster.
Technical Indicator Breakdown (4-h Timeframe & Daily Levels)
Momentum & Oscillators
Taking a look at the 4-hour chart, ApeCoin’s RSI is sitting at around 35.7, which suggests we’re in somewhat bearish territory—though we’re not quite oversold yet. The MACD tells a similar story: the MACD line has dropped below its signal line, and we’re seeing a negative histogram. That’s typically not a great sign for bulls. Both the 4-hour simple and exponential moving averages are sitting above the current price—the SMA is around 0.13009 and the EMA is near 0.12838. Essentially, price is trading below these short-term trend indicators, which reinforces that bearish tilt.
Support / Resistance via Pivots & Key Levels
The daily pivot structure gives us some clear zones to watch. The central pivot sits at about 0.12510, with resistance clustering around 0.12670 to 0.13140. On the downside, support zones appear near 0.12200 and 0.12040, with a deeper level around 0.11730. Since we’re currently trading at 0.12374—just below that pivot—it suggests a bit of a bearish lean. We’d really need to push back above that first resistance zone to flip the script and generate some positive momentum.
All things considered, the technical picture from both the 4-hour timeframe and the daily pivots is leaning bearish for now. That said, there’s definitely potential for a bounce if we can hold support around the 0.12 level.
Price Predictions & Scenarios
Bearish Scenario
If sellers keep the pressure on—and given what we’re seeing with the MACD and RSI—there’s a real possibility we test that first support zone around 0.12200 USDT. If that level doesn’t hold, we could easily slide down toward **0.12040 or even 0.11730**. Breaking through these zones without solid buying interest could accelerate the decline, especially if trading volume stays weak or if any negative news hits the wire.
Bullish/Relief Scenario
For the bulls to take back control, ApeCoin needs to climb back above that daily pivot around 0.12510 and actually hold it. From there, the next targets would be resistance levels near 0.12670 and then 0.13140. If we manage to break above 0.13140 with strong volume backing it up, we could see a shift toward a more neutral or even bullish short-term outlook. Still, I’d be cautious about calling it a full trend reversal until we see some confirmation on higher timeframes and clear breaks of longer-term resistance.
Probability & Key Trigger Levels
Being realistic about it, the probabilities right now seem to favor more downside—maybe around **60 to 70%** chance of continued weakness over the next day or two, unless something changes. The key levels to keep your eyes on: if we stay above 0.12200, we might avoid a bigger selloff. But if we can push above 0.12800 to 0.13140, that could spark a relief rally. Outside of technicals, keep an eye on trading volume and any real-world progress with Project R.A.I.D.—those could be the catalysts that shift sentiment.
Final Takeaway
Bottom line: APE/USDT is looking a bit shaky right now. Momentum indicators are tilted bearish, and we’re more likely to see downside than upside in the immediate term. The supports around **0.12200 to 0.12040 USDT** are absolutely critical—if those break, we’re probably heading down to test **0.11730 USDT**. On the flip side, reclaiming resistance around **0.12670 to 0.13140 USDT** would be a positive sign and could shift the bias back to neutral or cautiously bullish. Fundamental developments like Project R.A.I.D. gaining traction or real adoption in decentralized apps could change the game, but until then, expect choppiness and potentially lower prices unless we get a strong volume surge or some positive news to turn things around.