Market Context and Recent News
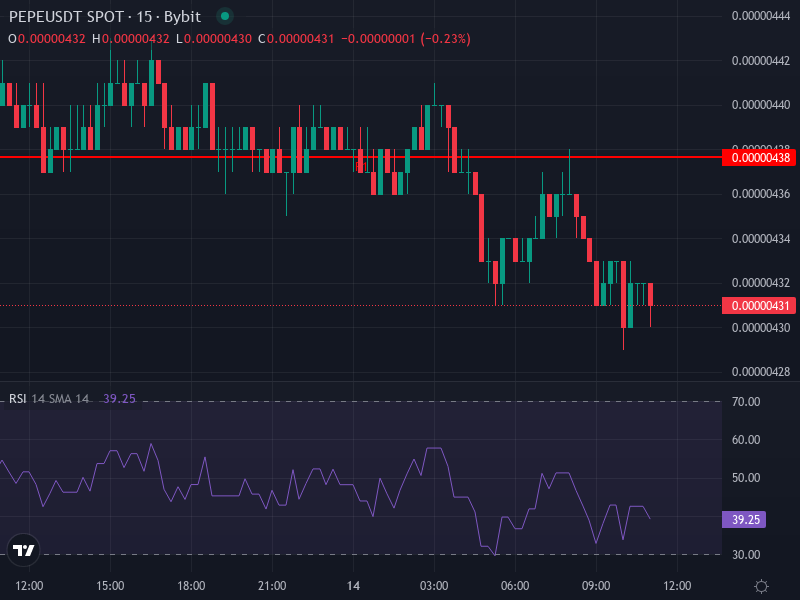
Pepe (PEPE/USDT) is currently sitting at around 0.00000431 USDT, down roughly −2.15% in the last 24 hours. It’s been a rough ride lately, with the token continuing its downward slide over the past week and month. We’re looking at losses near −19-20% for the month, and things get even uglier when you zoom out to the yearly chart. Daily price action keeps closing below the MA50 and MA100 lines, which tells us the bears are pretty much in control right now.
What’s driving this? Well, retail traders seem to have lost their appetite for speculative meme coins, broader market conditions have people playing it safe, and honestly, there’s just not much happening to get bulls excited. The technical picture is pretty messy too—some sources are calling PEPE a “Strong Buy” overall, but dig deeper and you’ll find plenty of moving averages flashing sell signals or sitting neutral. Other analysts are predicting we could drop below 0.000004 USDT, pointing to weak momentum and negative sentiment. It’s a coin caught between conflicting signals, which pretty much sums up where we are in this cycle.
Technical Indicators Analysis
Looking at the four-hour chart, the RSI is hovering around 37.6—getting close to oversold territory but not quite there yet. The MACD tells a similar story: all three components are negative (MACD ≈ −6.99×10⁻⁸, signal ≈ −6.52×10⁻⁸, histogram ≈ −4.68×10⁻⁹), showing bearish momentum that’s weak but definitely still present. Price is trading below both the four-hour SMA (~0.0000045413) and EMA (~0.0000044734), which confirms the bears are calling the shots in the short term.
The daily pivot points give us some important levels to watch. The central pivot sits at 0.0000043333, with resistance stacked up at R1 ≈ 0.0000043767, R2 ≈ 0.0000044533, and R3 ≈ 0.0000044967. On the downside, support shows up at S1 ≈ 0.0000042567, S2 ≈ 0.0000042133, and S3 ≈ 0.0000041367. If PEPE can’t break through and hold above R1 and R2, we’re probably headed down to test S1 and potentially lower. Recent price behavior within this range hasn’t been encouraging—the weakness is real.
Price Prediction Based on Scenarios
Bearish Baseline Scenario
If things keep going the way they’ve been going—MACD staying negative, RSI unable to push past 45, and price getting rejected at the four-hour moving averages—we’re likely headed down to test support. First stop would be S1 around 0.0000042567 USDT. If that breaks, we’re probably sliding to S2 at 0.0000042133, and if sellers really pile on, S3 at 0.0000041367 comes into play. In plain terms, we could be looking at another −5% to −10% drop over the next several days, especially if the broader crypto market stays choppy and money keeps flowing out of meme coins. It’s not a pretty picture, but it’s the more likely scenario given current conditions.
Bullish Reversal Scenario
Now, could PEPE turn things around? Sure, but it would need some serious confirmation. We’d need to see price reclaim the EMA4h (~0.0000044734) and close above the SMA4h (~0.0000045413). The RSI would need to climb back above 50, and that MACD histogram would have to flip positive. First hurdle is clearing R1 (~0.0000043767), then pushing through R2 (~0.0000044533). If PEPE manages to get above 0.00000450 USDT and hold it, momentum could carry it toward R3 (~0.0000044967) or even higher. That would mean potential gains of +5% to +12% in the right conditions. The catch? This scenario needs stronger volume and some kind of catalyst—whether that’s renewed meme coin hype, a broader market rally, or something specific to PEPE. Without that fuel, any bounce is likely to fizzle out pretty quickly at resistance levels.