Recent Developments and Market Sentiment
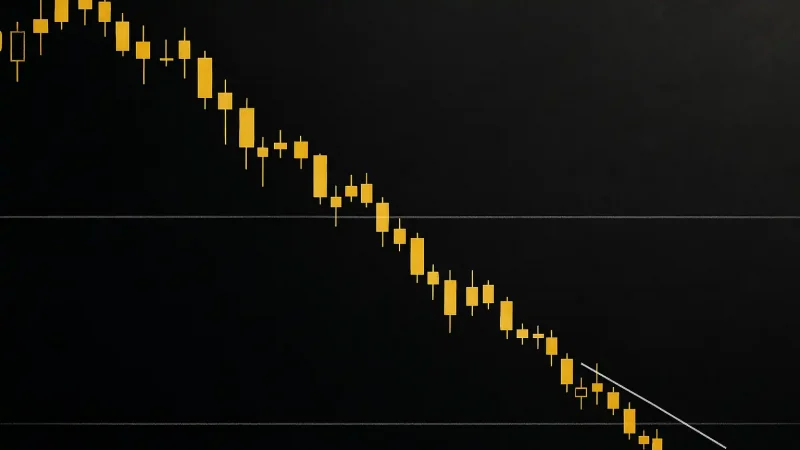
In early December 2025, Siren (SIREN) is trading around $0.0883 USDT with a 24-hour trading volume close to $3.75 million and roughly 729 million tokens in circulation. The token has taken quite a hit, falling more than 55% from its peak of about $0.1976 back in May 2025. A big part of this drop comes from several exchanges delisting the token—platforms like WEEX and Gate.io stopped spot trading, which squeezed liquidity and made it harder for both retail and institutional traders to access the market.
Looking at the technical signals, we’re seeing a pretty mixed bag right now. Some short-term moving averages are flashing buy signals, but when you zoom out to the 50-day, 100-day, and 200-day averages, they’re all pointing toward sell. The Relative Strength Index (RSI) is hovering around 50, basically sitting on the fence and not giving us much to work with in terms of clear direction.
Chart Patterns, Support & Resistance Zones
The price has dropped below several important moving averages, including the 7-day and 30-day SMAs. Trading below these levels is typically a bearish signal, meaning those averages are now acting as resistance that price will need to break through to move higher. On the downside, we’ve got some historical support sitting around $0.07-$0.08, with $0.073 being a really critical level to watch. If we break below that, things could get ugly pretty quickly.
For resistance, we’re looking at the $0.09-$0.095 area where previous support has flipped to resistance. The 200-day SMA is also hanging out up there, creating another barrier for bulls to overcome.
Momentum isn’t looking great either. The MACD has rolled over and confirmed a bearish crossover recently. The Average Directional Index (ADX) is showing strong trend strength, but unfortunately that trend is pointing down right now. Interestingly, volatility seems pretty subdued based on ATR readings, which means we might not see big moves unless something significant happens—like news or exchange-related events.
Price Prediction Scenarios
Given what we’re seeing in the charts and market structure, here are the two main scenarios that could play out:
Bullish Reversal Case
For the bulls to take control, SIREN needs to reclaim and hold above that $0.090-$0.095 resistance zone with solid volume backing it up. If that happens, we could see a run toward $0.11. A convincing breakout above $0.095 with good momentum might even push things to $0.13, targeting some Fibonacci extension levels and old support zones that have turned into resistance. Watch for increasing volume, a bullish MACD crossover, and RSI climbing above 55 to confirm this scenario.
Bearish Continuation Case
If SIREN can’t break through resistance and keeps trading below those moving averages, we’re probably headed back down toward $0.073. Breaking below that support could open the door to an even deeper drop toward $0.055-$0.06, where we might find the next solid support based on previous lows. Weak momentum, declining volume, and negative market sentiment would all support this downside scenario.
Key Indicators to Watch
If you’re trading or investing in SIREN, keep your eyes on these indicators:
- RSI behavior in the 45-55 range: breaks above or below this zone will help clarify which way we’re headed next.
- MACD histogram and signal line: if this turns positive, it could signal a bullish reversal; staying negative likely means more downside.
- Moving average levels: particularly the 30-, 50-, and 200-day SMAs acting as resistance.
- Volume activity: both in spot and derivatives markets—big volume moves often come before or during real breakouts or breakdowns.
- News and catalysts: things like new exchange listings, expanded utility in AI or DeFi, or better exchange access could change the game quickly.
Final Insight
While there’s definitely upside potential if SIREN can get its momentum back and push through resistance, the current technical picture and market sentiment lean toward more downside unless we get some strong positive catalysts. The $0.08 level is absolutely crucial—holding above it keeps hope alive, but failing to do so could mean more pain ahead. On the flip side, if we see a solid recovery above $0.095 with strong volume, that could shift the outlook back to neutral or even cautiously bullish.