Market Context and Recent Developments
Pudgy Penguins—or $PENGU—has come a long way from its NFT roots. The project nearly went under in early 2022, but new leadership turned things around by pushing hard into physical products like plush toys and collectibles, building out the brand’s consumer appeal. That strategy seems to be working: the team is looking at roughly $50 million in revenue for 2025, thanks to merchandising deals and retail partnerships with big names like Walmart, plus a dedicated community that’s stuck around through thick and thin.
The token has been getting attention lately too. Canary Capital recently filed to create an ETF that would hold a big chunk of $PENGU along with some Pudgy Penguins NFTs—potentially opening the door for traditional finance types to get exposure to what started as a meme coin. Naturally, that’s stirred up some speculation.
From a technical standpoint though, things look a bit rocky. The MACD has flipped negative on the daily chart, RSI is hanging around neutral to slightly bearish levels, and most moving averages from the 20-day out are pointing down. So while we might see some short-term bounces, the overall trend isn’t exactly inspiring confidence right now.
Current Technical Snapshot and Short-Term Price Action
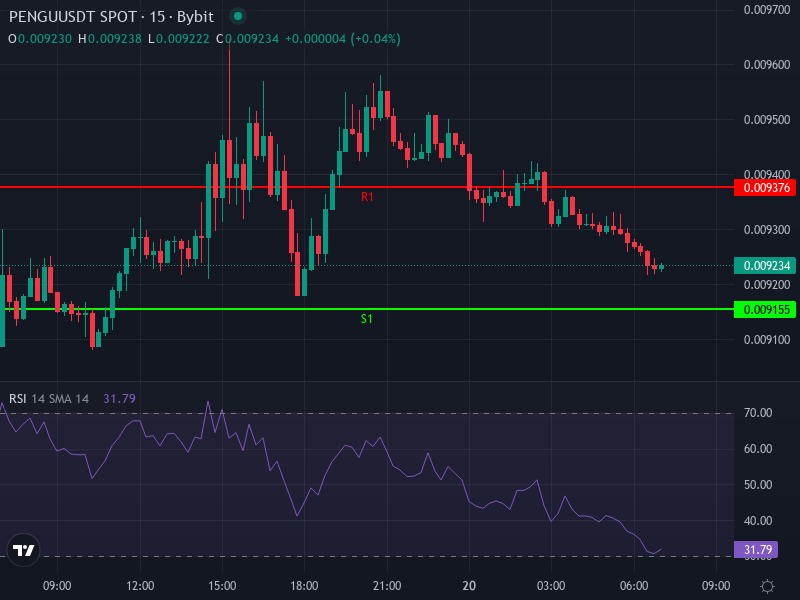
Right now, PENGU/USDT is trading around $0.00922, up a modest 0.65% over the last day. But if you zoom into the 4-hour chart, there are some warning signs. The RSI is sitting at about 42—below the 50 midpoint—which tells us there’s no strong momentum in either direction and we’re not quite oversold enough for an automatic bounce yet.
The MACD on the 4-hour is slightly in the red, though the histogram is starting to flatten and tick upward a bit—so if buyers start showing up, we could see momentum shift.
Here’s the thing though: both the 4-hour simple and exponential moving averages are hovering around $0.00963 to $0.00965, well above where we’re trading now. That means PENGU is beneath its short-term trend line, and those MA levels are going to act as resistance if the price tries to climb back up.
Daily pivot levels put the immediate resistance between $0.00930 and $0.00960, with support down around $0.00915 to $0.00893, and deeper levels below if those don’t hold. So any rally is probably going to run into a ceiling pretty quickly unless we see serious volume come in.
Key Levels to Watch
- Resistance: The $0.00960–$0.00965 zone (where those 4-hour moving averages sit) is the first hurdle; beyond that, $0.0100 is a nice round number and psychological barrier that could signal a trend reversal if broken.
- Support: The $0.00915–$0.00900 range is the first line of defense; if we drop below $0.00893, things could get ugly fast.
- Volume & Catalysts: Without something big—like ETF approval news or strong sales numbers—it’s hard to see a major rally happening. If we do break above $0.00965 with solid volume behind it, $0.0100 becomes the next target; if we fail, expect the focus to shift back down to support levels.
Medium-Term Outlook and Scenarios
Looking at the technical picture alongside recent market activity, here’s how things could play out over the next few weeks:
- Base case (modest bounce): Price finds a floor somewhere between $0.00915 and $0.00900. Buyers make a run at those 4-hour moving averages around $0.00960. If they punch through with decent volume, we could see a move toward $0.0100 to $0.0105. But there’s heavier resistance above that—daily and weekly moving averages are stacked up there—so breaking through will take real momentum.
- Bearish continuation: If sellers keep the pressure on—maybe because of bad news, regulatory concerns around USDT, or the ETF filing going nowhere—we could slip below $0.00890. That would likely trigger stop losses and send us down toward $0.0085 or lower. In that scenario, any bounces would probably be weak and short-lived.
- Bullish breakout: If the ETF gets approved, or we see really strong merchandise sales reports, or there’s a volume spike that breaks through resistance, the story changes. Then we’d be looking at $0.0105 to $0.0110 as realistic targets, with potential upside of 20-40% from here depending on how strong the move is. But that really needs a catalyst to happen—it won’t come from technicals alone.
Risk Factors and Monitoring Points
Here’s what you should be keeping an eye on:
- Any news about the Canary Capital ETF filing—whether it gets approved or rejected could move the price significantly in either direction.
- Regulatory developments around stablecoins, especially USDT—any problems there could ripple through the entire PENGU/USDT pair.
- Whale wallet movements—large transfers to exchanges often mean selling pressure is coming; accumulation away from exchanges usually helps stabilize things.
- Volume patterns—rallies on strong volume are legit; rallies on weak volume tend to fail at resistance levels.
- Overall crypto market health—altcoins like this tend to exaggerate whatever Bitcoin and the broader market are doing, so if the macro environment turns sour, expect PENGU to feel it.