Current Market Context & Technical Setup
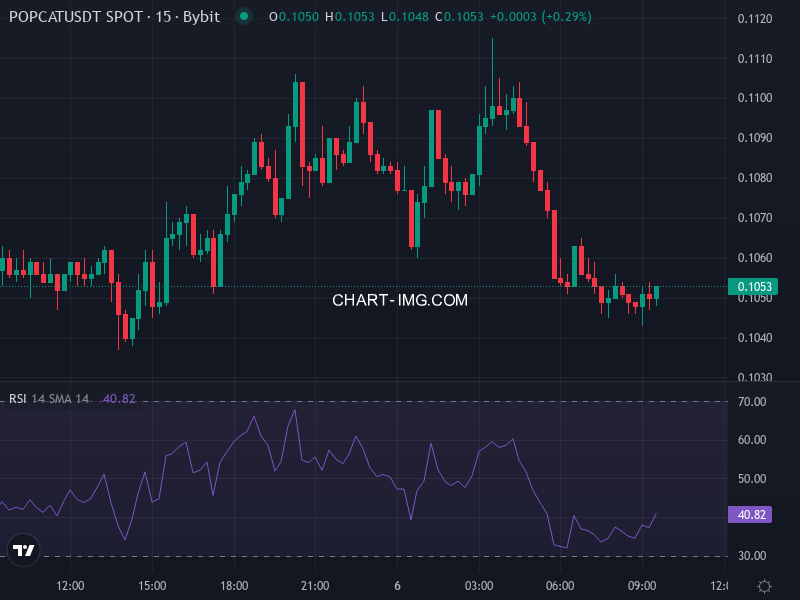
Right now, Popcat (SOL) is sitting at around $0.10475, down about −3.48% over the last 24 hours. The price has slipped just beneath some of the short-term moving averages, which tells us there’s a bit of a tug-of-war happening between buyers and sellers. What’s interesting is that the technical signals are kind of all over the place depending on which timeframe you’re looking at. Daily charts are leaning toward buy signals with the Moving Averages, but when you zoom into shorter periods, indicators like RSI, MACD, and Williams %R are screaming that we might be oversold or exhausted. So yeah, we’re in for some wild swings in the near term—momentum could flip either way pretty quickly.
The 50-day and 200-day simple moving averages are still hanging **above** where we’re trading now, which basically means those levels are acting as resistance that traders will need to punch through. On the support side, we’re seeing a pretty solid foundation building between $0.08 and $0.09—you can see this echoed in the Bollinger Band lows and previous consolidation areas. If the price drops below that range, things could get ugly fast with algorithmic selling kicking in. But if we manage to break through the resistance around $0.110-$0.115? That could reignite some bullish energy and push us toward $0.13 or even higher.
Key Technical Indicators & Trading Signals
Let’s dig into what the momentum tools are actually telling us. The RSI (14-day) has been hanging around the 30–40 range, which suggests momentum is pretty weak and we’re possibly oversold. That said, we haven’t seen any clear bullish divergence yet to get excited about. The MACD histogram is sitting slightly negative or flat on the shorter timeframes—sellers are in control, but it’s not like we’re in freefall either. Williams %R is showing oversold conditions too, which might create some opportunities for quick bounce trades, but honestly, that’s not enough by itself to call a trend reversal.
The moving averages are really important here: the 5-, 10-, and 20-day MAs are floating just above the current price, so they’re probably going to act as immediate resistance if we try to push up. The longer-term averages (50-day, 100-day) are way above where we’re trading, which confirms the bigger picture is still under pressure. Volatility indicators like ATR and Bollinger Bands are showing elevated ranges, so expect some sharp moves throughout the day. If you’re trading this, you’ll probably want to focus on shorter timeframes, especially when volume starts picking up.
Support & Resistance Zones to Watch
Support: The $0.080 – $0.090 zone is really critical here—it’s the floor we need to hold. If we break below that, we could be looking at a drop toward $0.070.
Resistance: Near-term resistance is sitting at $0.110-$0.115. If bulls can break through that, the next stop would be around $0.130 assuming momentum actually comes back.
Price Prediction Scenarios
Looking ahead over the next few weeks, there are basically two paths this could take:
- Bearish continuation: If Popcat can’t get back above that $0.110 resistance level, sellers are probably going to push it down to $0.090 first, then $0.080. And if we lose $0.080? Well, in a worst-case scenario, we could see $0.070. This path makes sense given the negative momentum, weak short-term trend, and all those moving averages sitting above current price.
- Bullish reversal: Now, if volume really picks up and we get some solid closes above the short-term moving averages (particularly the 20-day and 50-day around $0.110), we could see a nice run toward the $0.130 area. But honestly, this would need some kind of catalyst—maybe renewed memecoin hype, strength across altcoins generally, or whales jumping back in.
My base case? I think we’re more likely to see Popcat drift back toward the **$0.085–0.095** range in the near term, with potential upside to **$0.120** if we somehow manage to break resistance and get momentum shifting. In a really bullish scenario where things reverse hard, $0.130-$0.150 becomes possible, but that’s probably not happening without some bigger positive forces in the overall market.
Market Sentiment & News Drivers
Beyond all the technical stuff, the memecoin narrative is still one of the biggest drivers for Popcat. We’ve been seeing some renewed retail interest and what looks like bigger wallets quietly accumulating. That kind of behavior often comes before speculative rallies, especially in tokens with lower liquidity. But there’s a flip side—negative news about potential manipulation and past spoofing incidents have definitely hurt confidence, particularly when markets are thin and even small moves can cause crazy price swings.
And of course, what happens with the broader crypto market matters a lot here. When Bitcoin dominance rises, capital tends to flow out of altcoins and memecoins like Popcat. Plus, macroeconomic stuff—think interest rate expectations or regulatory headlines—can really tighten up risk appetite across the board. Because Popcat is so volatile, it basically amplifies whatever’s happening in the market, both good and bad, compared to most other assets in the Solana ecosystem.
Final Insight
Popcat (SOL) is basically at a crossroads right now from a technical standpoint. The short-term outlook is leaning bearish unless buyers can push through and reclaim that resistance around $0.110. If that doesn’t happen, we’re probably headed down toward $0.080. But if we do get a breakout above resistance on strong volume with some positive news behind it? Then yeah, a move toward $0.120 and potentially beyond becomes realistic. Whatever you do, manage your risk carefully here—keep position sizes reasonable—because this environment is primed for sharp moves and sentiment can flip on a dime.