Recent Developments & Ecosystem Pulse
Pudgy Penguins has really grown beyond just being another NFT project—it’s becoming a genuine Web3 brand with serious staying power. The team’s push into traditional retail is pretty impressive, with QR-linked toys now sitting on shelves in over 3,100 Walmart stores, plus partnerships with Target. This physical-digital hybrid approach is actually working, giving the project real-world credibility while most NFT collections are struggling to stay relevant.
The launch of $PENGU on Solana brought roughly 88 billion tokens into circulation, and the community response has been genuinely strong. What’s particularly interesting is the institutional attention it’s getting—there’s even talk of a Canary PENGU ETF that would hold mostly $PENGU tokens with some Pudgy Penguins NFTs mixed in. If that happens, we could see significant capital flowing in, though it’ll also mean more regulatory scrutiny and higher performance expectations from traditional finance folks.
Key Technical Indicators & Current Price Action
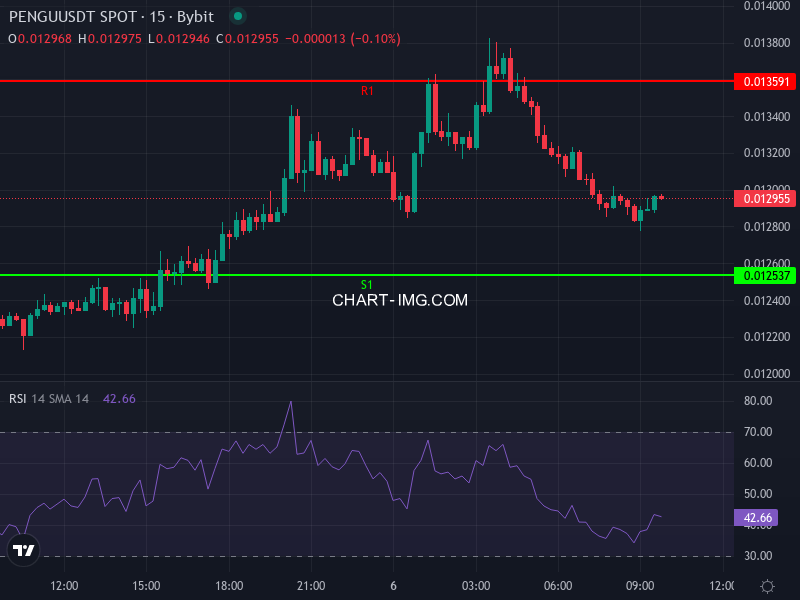
Right now, $PENGU/USDT is trading around $0.012945, which marks about a 3.45% gain over the last day. When you look at the 4-hour chart, the Relative Strength Index is hovering near 66.53—that’s telling us momentum is solid but we’re getting close to overbought levels where things could cool off.
The MACD on that same 4-hour timeframe shows the line sitting just below the signal line with a small negative histogram forming. That’s usually a warning sign of potential bearish pressure building up. That said, the price is still comfortably above both the Simple Moving Average at roughly $0.01147 and the Exponential Moving Average around $0.01171, so the overall trend is still pointing upward for the time being.
Daily pivot levels give us some clear targets to watch:
• Resistance sits at R1 around $0.01359, R2 at $0.01423, and a more ambitious R3 target near $0.01464.
• Support zones are at S1 roughly $0.01254, S2 at $0.01212, and deeper support down around S3 at $0.01148.
Near-Term Scenarios (Next 3-14 Days)
If buyers keep showing up with enthusiasm, we’ll probably see $PENGU test that first resistance wall near $0.01359 pretty soon. Breaking through there with conviction could quickly push us toward the $0.0142–$0.0146 range. These levels line up with previous intraday highs, so they’re definitely important breakout points to watch.
On the flip side, if we see profit-taking kick in near resistance—especially with those bearish MACD signals and the RSI getting stretched—we could easily pull back to support around $0.01212-$0.01254. If that support doesn’t hold, we might see a deeper slide toward $0.01148. Any negative news, regulatory concerns, or a drop in trading volume would make that downside scenario more likely.
Mid-to-Long-Term Outlook & Risk Factors
Looking weeks or months ahead, $PENGU’s success won’t come from short-term hype cycles—it’ll depend on whether the brand delivers real utility, solid adoption numbers, and navigates the regulatory landscape successfully. That ETF filing could be a game-changer if it gets approved, potentially bringing in institutional money and legitimacy that could push the price toward $0.02 or beyond. But without those big catalysts, or if regulators start asking tough questions about tokenomics and governance, we could see bears take control.
There are definitely risks worth considering here: NFT floor prices could keep sliding, the broader altcoin market might tank, retail or licensing partnerships could fall apart, and the team might miss key roadmap milestones like Pudgy World features or game launches. On the positive side, stronger physical product sales, a healthy NFT ecosystem, and actual adoption in gaming or entertainment could provide solid long-term support for the price.
Technical Targets & Strikes
Here’s how things could play out based on what the charts are showing:
• Bull case scenario: $0.0145–$0.0155 if we break resistance and momentum stays strong.
• Base case scenario: trading sideways in the current channel between $0.01250 and $0.01350.
• Bear case scenario: dropping toward $0.01150 if support levels give way.