
Recent Context and Market Shifts
Notcoin is currently trading around $0.0005223, posting a modest 24-hour gain of +2.38%. Recent data shows the price hovering near $0.000535, with daily trading volume sitting at roughly $7.7 million. After weeks of decline, NOT appears to be gaining some traction, with momentum indicators like MACD and RSI starting to show signs of life. That said, the token still faces headwinds—macro uncertainty, Bitcoin’s dominance near 59%, and broader questions about when the TON ecosystem will really take off all weigh on sentiment.
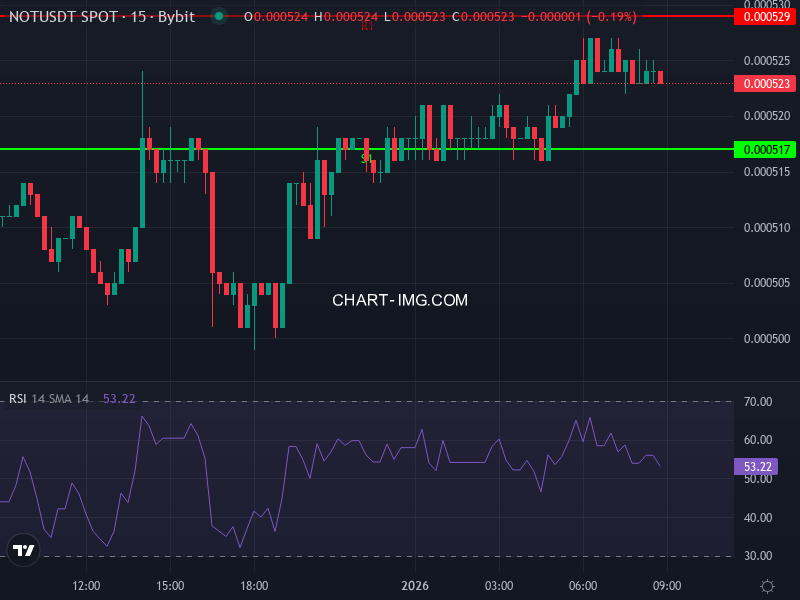
Technical Indicators & Price Structure
Looking at the 4-hour chart, the RSI is sitting around 52.36—pretty much right in the middle. NOT isn’t overheated, but it’s not exactly beaten down either. The MACD histogram has just turned slightly positive, hinting at early bullish momentum, though the MACD line itself is still struggling to cross above its signal line. Moving averages paint a mixed picture: the 4-hour SMA at roughly $0.0005260 is acting as immediate resistance, while the 4-hour EMA near $0.0005215 provides nearby support. Zoom out to the daily chart, and things look more cautious—most medium-term moving averages (the 50-day, 100-day) are sitting above price, creating layers of overhead resistance.
Support and resistance levels matter a lot right now. Daily pivot points put the main resistance zone between $0.000528 and $0.000537, with support holding in the $0.000513 to $0.000517 range. If NOT can break cleanly above $0.000537, there’s room to run toward $0.00057 or higher. But if it fails to reclaim that resistance, we could easily see a pullback toward stronger support around $0.000477.
Price Paths: Scenarios Moving Forward
Scenario A: Bullish Reversal
If Notcoin manages to hold above its 4-hour EMA and pushes through that stubborn resistance around $0.000537, we could be looking at a move toward $0.00057 to $0.00062. In this scenario, the MACD crossover would confirm, the RSI would climb above 55, and momentum indicators like the commodity channel index and ADX would back up the trend. A catalyst—maybe a big announcement from the TON team or a new use case—could be the spark that gets things moving.
Scenario B: Prolonged Consolidation or Downside Risk
On the flip side, if NOT loses its footing at the EMA support near $0.000521 or slips below the pivot around $0.000525, things could get rocky. The next stop would likely be the support cluster between $0.000513 and $0.000517. If that gives way, we’re looking at a potential test of $0.000477, or even a revisit of prior lows around $0.000444 to $0.000406. The bearish lean from the daily moving averages, combined with Bitcoin’s strength pulling capital away from altcoins, makes this downside scenario more than just a theoretical risk.
Final Insight: What Traders Should Watch
The truth is, Notcoin is at a crossroads. Whether it breaks out or breaks down depends on whether bulls can push through that mid-$0.00053 resistance zone. Here’s what to keep an eye on:
- MACD behavior on both 4-hour and daily charts—watch for a solid crossover
- RSI staying above 50, which would signal buyers are in control
- How price reacts at key moving averages, especially closing above the 50-day and 100-day
- Any news from the TON ecosystem—adoption updates or partnerships could move the needle
Until we see a clean break above resistance, the downside risk is real. If you’re thinking about going long, waiting for confirmation near support with clear momentum makes sense. For the more aggressive traders, resistance levels might offer shorting opportunities or spots to hedge. Either way, patience and solid risk management are key here.