Market Context and Key Developments
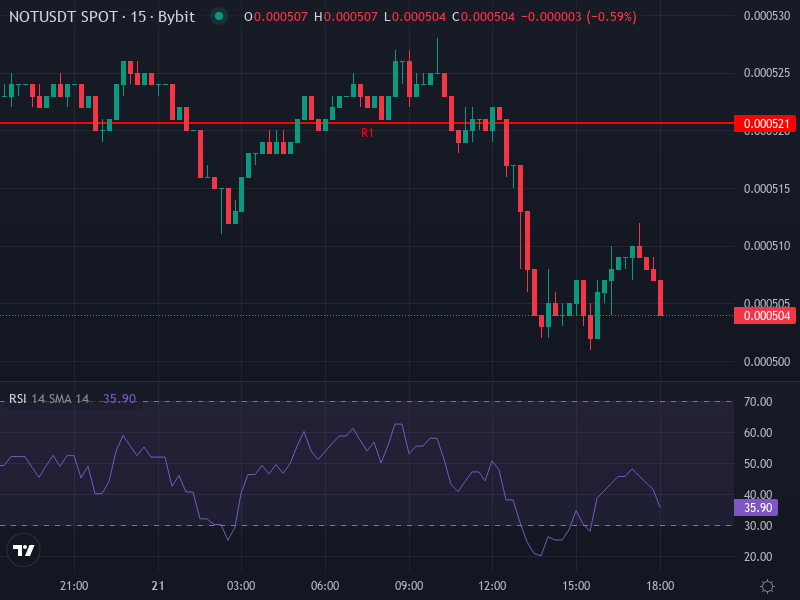
Notcoin (NOT) is currently trading at around $0.00050538, down roughly −3.43% over the past 24 hours. The pullback isn’t happening in isolation—larger market forces are weighing heavily on smaller altcoins right now. Bitcoin’s dominance has pushed past 58%, which tends to drain momentum and capital away from projects like NOT. On top of that, the Fear & Greed Index is firmly in “extreme fear” territory, signaling that traders are in a defensive, risk-off mindset when it comes to more speculative plays.
This decline follows a sharp spike on December 8, when NOT briefly touched $0.00075 before running into heavy profit-taking. The price has since broken below some important technical levels, including the 61.8% Fibonacci retracement at around $0.000591. That breakdown triggered a cascade of selling—likely amplified by automated trading and derivatives activity—which has left NOT’s short-term structure looking pretty fragile.
Technical Indicators and Short-Term Bias
Looking at the 4-hour chart, the Relative Strength Index (RSI) is sitting at around 41.1. That’s not quite oversold yet, but it does show that momentum is fading fast. The MACD is barely holding in positive territory, with both the MACD line and signal line dipping into negative zones—another sign that any upward momentum has pretty much stalled out.
Price is currently trading below both the 4-hour Simple Moving Average (SMA) at roughly $0.0005146 and the Exponential Moving Average (EMA) near $0.0005219. Both of these are now acting as overhead resistance, making it tough for NOT to push higher without some real buying pressure.
The daily pivot levels paint a similar picture. The main pivot sits at about $0.0005103. Resistance levels are stacked above at $0.0005207 (R1), $0.0005363 (R2), and $0.0005467 (R3). On the downside, support levels come in at $0.0004947 (S1), $0.0004843 (S2), and $0.0004687 (S3). If NOT can’t push back above the SMA/EMA and pivot zone, there’s a real risk it could drift down toward the S1–S2 range in the near term.
Critical Price Levels to Watch
- Resistance Zone: $0.0005200–$0.0005300, where the SMA/EMA cluster and the R1 pivot are clustered together.
- Support Zone: $0.0004950–$0.0004850, with a deeper floor around $0.0004687 (S3) if things get worse.
- Breakout Threshold: A daily close above $0.000550 could open the door to testing R2 and R3, which would be a meaningful shift in sentiment.
- Breakdown Risk: If we see a drop below $0.000470, the next downside targets would be around $0.000440–$0.000420.
Price Prediction Outlook for December 2025 to Early 2026
Based on how things are shaping up technically and the broader market headwinds, most forecasts are pointing toward more downside or sideways action before any real recovery takes hold. Some models are eyeing a move down toward $0.0003991 by mid-January 2026, assuming resistance around the mid-$0.0005 area continues to hold firm. Other estimates have NOT trading somewhere between $0.00037 and $0.00053 through the end of December.
There is a more optimistic scenario where NOT bounces strongly above resistance and climbs toward $0.00065–$0.00070, but that would require some positive catalysts—things like improved market liquidity, favorable regulatory news, or significant ecosystem growth. Without a confirmed break above key resistance levels, that scenario remains more hopeful than likely.
Fundamental & Sentiment Catalysts
Beyond the charts, NOT’s future really depends on how well it integrates into the TON ecosystem and whether there’s any regulatory clarity coming, especially under frameworks like MiCA. The token’s liquidity is already pretty thin, which means it can swing wildly on relatively small volume. That said, if TON delivers some meaningful updates—new exchange listings, protocol upgrades, cross-chain bridges—it could provide a short-term boost and help stabilize sentiment.
Concluding Insight
Right now, the odds favor continued bearish pressure on NOT heading into early 2026 unless it can reclaim the $0.0005200–$0.0005500 resistance zone with conviction. The support levels around $0.0004950 down to $0.0004687 offer some cushion, but they’re not strong enough to build a bullish case on their own without some fundamental improvement or shift in market conditions. For traders, the key is to watch how price behaves at these critical levels. A break above resistance could signal upside potential; a failure at support likely means more downside ahead.