Recent Momentum & Contextual Factors
The memecoin Moo Deng (MOODENG) has been riding the Solana meme coin wave and turning heads with its wild price swings over the past several months. Things really heated up when Robinhood added it to their platform back in May 2025—the token jumped nearly 30% in both volume and price practically overnight, pushing its market cap into the low hundreds of millions. Before that, it had already gotten a nice bump from Binance Alpha exposure and some pretty aggressive speculative trading.
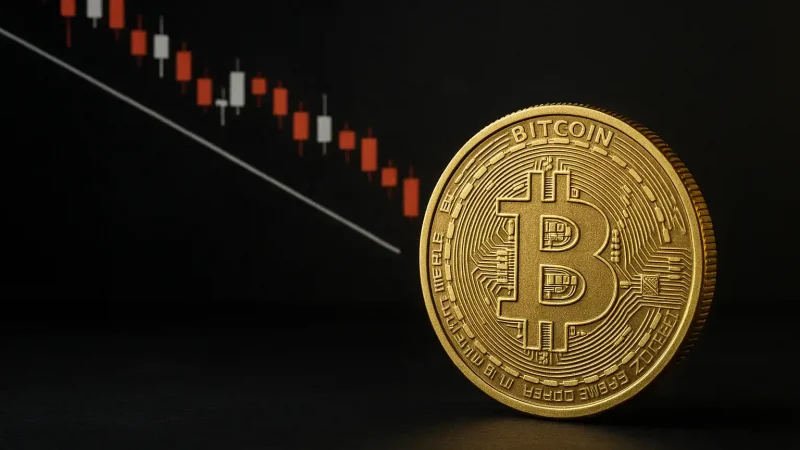
But here’s the thing with meme coins—what goes up fast can come down even faster. After hitting some impressive peaks, MOODENG has taken some brutal hits, dropping anywhere from 60% to 70% from its all-time highs. This boom-and-bust pattern is pretty textbook for hype-driven tokens, especially ones that live and die by Twitter trends rather than any real underlying use case.
Technical Indicator Analysis and Price Projections
Right now, MOODENG is sitting at $0.09544 USDT, up about 20% in the last 24 hours—which definitely looks bullish in the short term. Without diving into every single candle on the chart, we’re looking at what’s happened historically to figure out where this thing might be headed next.
From what we’ve seen before, the $0.10 to $0.12 range has been tough to crack on the way up. When the price has pushed higher in the past, around $0.18 to $0.20 is where it tends to run out of steam. On the flip side, after major selloffs, the token has found some footing around $0.05 to $0.08, which tells us that’s where buyers tend to step back in.
Support, Resistance, and Moving Averages
Looking at support levels, the $0.07 to $0.08 zone seems like the safety net here. If the price pulls back and holds there, we could see buyers regain confidence and potentially set up for another run. The first real test on the upside is around $0.12—break through that, and $0.18 to $0.20 comes into play as the next target, assuming the momentum doesn’t fizzle out.
As for moving averages, the shorter-term ones (think 7 to 21 days) might be crossing upward based on this recent surge, which would back up that bullish vibe. But honestly, without looking at the actual charts, that’s more of an educated guess. If the price can’t hold above $0.10, we’re probably heading back down to test those support zones again.
Potential Scenarios & Risk-Reward Balance
So where does MOODENG go from here? Looking at the patterns, there are basically two paths forward:
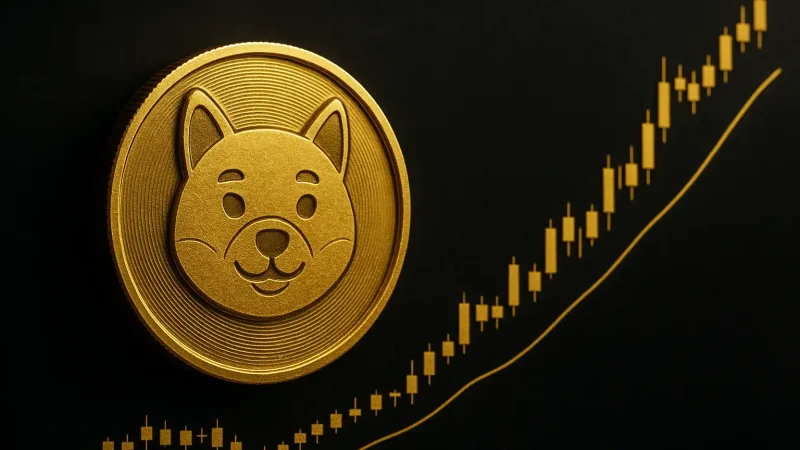
- Bullish breakout path: If buying pressure keeps up and we break cleanly above $0.10, there’s a decent shot at reaching $0.18 to $0.20. This would need strong volume, renewed hype (maybe another exchange listing or some positive buzz), and ideally a crypto market that’s not totally tanking.
- Correction or sideway drift: If that resistance holds and buyers lose interest, we’re probably heading back to the $0.07 to $0.08 support area. Lose that level, and things could get ugly fast—potentially dropping back to the $0.05 to $0.06 range. With meme coins, these swings can happen in a heartbeat.
Risk versus reward? Well, if you’re buying around the current price, you’re looking at maybe doubling your money if it hits $0.20. But the downside is pretty steep too—if sentiment turns negative or another shiny meme coin steals the spotlight, you could easily be down 30-40% or more.
Fundamental Catalysts & Long-Term Durability
Beyond just lines on a chart, MOODENG’s long-term survival depends on whether it can become more than just another meme. There’s been talk about integrating DeFi features, maybe some NFT stuff, and supposedly plans to partner with educational or charitable organizations. More exchange listings would certainly help too.
That said, let’s be real—right now this is still mostly a speculative play. There’s not much in the way of actual utility or governance structure, and people can get tired of memes pretty quickly. Plus, with a large circulating supply, it takes a ton of demand to move the needle significantly, especially if holders start taking profits.