Introduction: Recent Developments and Sentiment Shifts
The memecoin Moo Deng has been making waves in the crypto space over the past few months. Trading under the ticker MOODENG on Solana, this quirky token got a massive boost when Robinhood decided to list it. That listing day was wild—the price absolutely exploded, showing just how much these exchange announcements can move the needle for smaller tokens. What really caught people’s attention though was when MOODENG briefly surged past Dogecoin in trading volume on Coinbase. Yeah, you read that right. A relative newcomer outpacing the OG memecoin in volume, even if just temporarily. That’s the kind of retail frenzy we’re dealing with here.
But let’s pump the brakes for a second. Not everyone’s celebrating. Some analysts are waving red flags about what happens after these listing pumps—historically, we’ve seen brutal selloffs once the initial excitement fades. The concern is pretty straightforward: MOODENG is riding almost entirely on hype and social media buzz. There aren’t really any meaningful partnerships, utility, or ecosystem developments backing it up. If the crowd loses interest or moves on to the next shiny object, we could see a rapid unraveling. Still, trading volumes across major exchanges like OKX, WhiteBIT, and BitMart remain surprisingly healthy, which tells us there’s still money flowing in and out despite the volatility.
Current Technical Setting & Key Price Levels
Right now, MOODENG is sitting around $0.04672, down nearly 5% in the last day. That drop isn’t happening in a vacuum—the broader crypto market has been shaky lately, and memecoins tend to feel those tremors more intensely. Despite the decline, volume is still decent. We’re seeing millions of USDT changing hands daily across multiple exchanges, which suggests traders haven’t completely abandoned ship yet.
From a chart perspective, MOODENG has been respecting Fibonacci retracement levels surprisingly well. After its big rallies, the token has repeatedly tested that critical 0.618 Fib level—a zone where technical traders often look for buying opportunities. What makes this more interesting is that the 200-day moving average has been hanging around these same levels, creating a confluence zone where support might actually hold. There’s also some horizontal support from previous consolidation areas that lines up nicely here.
Looking up at resistance, things get trickier. The $0.25 to $0.30 range is where MOODENG hit its previous peaks, and anyone who bought near those highs is probably itching to get out if the price climbs back. That psychological baggage makes those levels formidable barriers. On the flip side, if we break below the current $0.046 area decisively, there isn’t a whole lot of obvious support until we get significantly lower. That’s the danger zone—thin air below with potential for accelerated selling.
Moving Averages, RSI, and MACD Dynamics
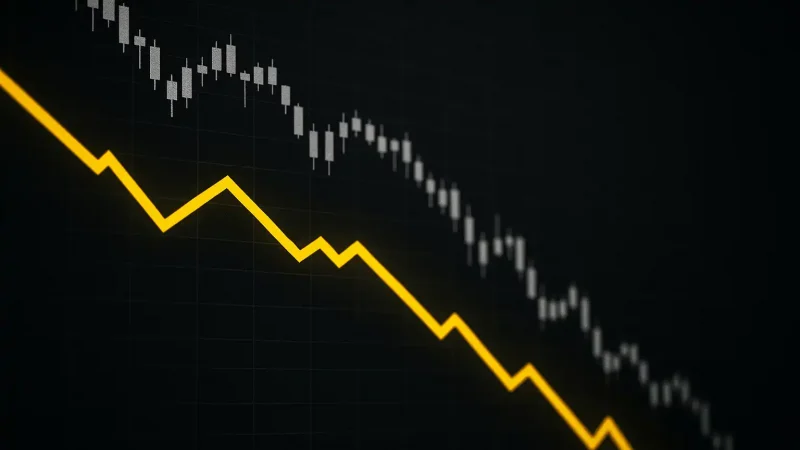
The moving average picture isn’t pretty in the short term. Price has sliced below recent averages, which typically signals more downside unless something changes the narrative quickly. However, that 200-day moving average I mentioned earlier has historically been a line in the sand where buyers have shown up during corrections. It’s worth watching closely.
The RSI has dipped into oversold territory during some of these sharp drops, which often sets up short-term bounce plays. But here’s the thing with memecoins—oversold can stay oversold if the broader memecoin sector is tanking. It’s a helpful indicator but not a guarantee. The MACD has been trending bearish lately with momentum clearly favoring sellers. We’d need to see a bullish crossover there before getting confident about any sustained recovery.
Technical Price Predictions and Scenario Forecasts
Starting from the current price of $0.04672, let’s map out three realistic scenarios based on what the charts and market dynamics are telling us.
- Conservative scenario: If support at $0.046 crumbles, we’re probably headed toward the $0.03–$0.04 range. This would happen if short-term moving averages continue pointing down and we get any negative catalyst—maybe a broader market dump or some unfavorable news. Volume would likely dry up on the way down as enthusiasm evaporates.
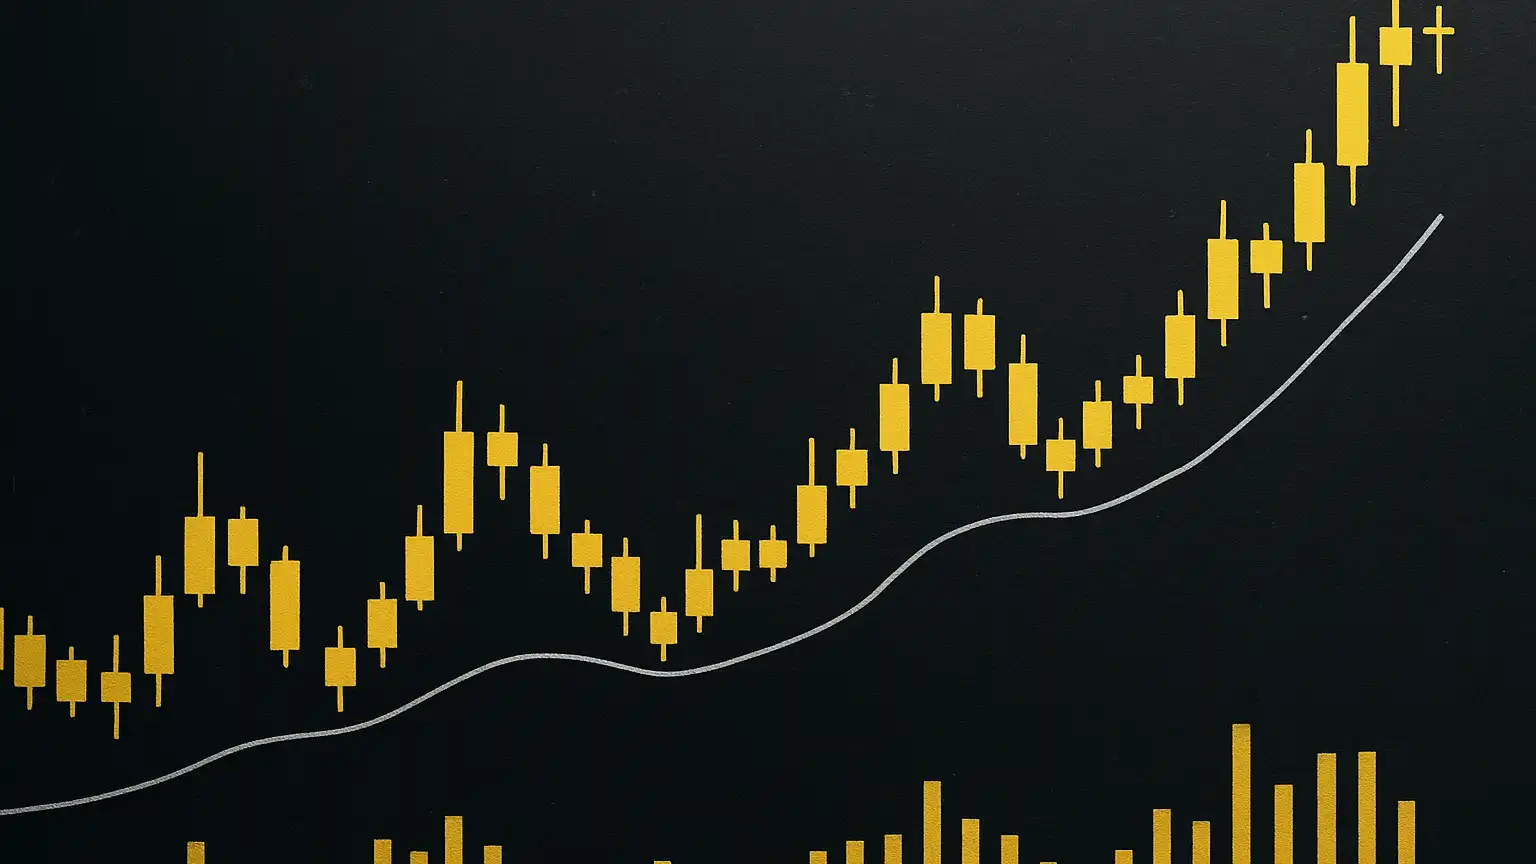
- Base case: MOODENG finds its footing between $0.045 and $0.05, establishes a higher low, and mounts a relief rally. In this scenario, we’d be looking at resistance around $0.08–$0.10. To get there, we’d need to see some technical improvements—maybe the 20-day and 50-day moving averages crossing bullishly, RSI climbing back above 50, that sort of thing. Nothing crazy, just normal recovery mechanics.
- Bullish breakout scenario: This is where things get interesting. If MOODENG catches another major catalyst—think another high-profile exchange listing, a viral social media moment, or a broader memecoin sector revival—we could see a run back toward $0.25–$0.30. But let’s be real: to pull that off, the token would first need to convincingly break through resistance around $0.15, and that would require serious volume and probably some help from favorable macro conditions.
Risks and Key Monitors
There are several landmines to be aware of if you’re trading or holding MOODENG:
- Exchange risk: If a major platform delists it or there are security issues with wallets holding it, confidence can evaporate overnight.
- Sentiment reversal: Memecoins live and die by attention. When the crowd moves on, prices can collapse shockingly fast because there’s no underlying business or product to fall back on.
- Liquidity dry-ups: If volume across exchanges starts dropping significantly, you could see wild price swings in both directions as it becomes harder to execute trades without moving the market.
- Resistance failures: Getting rejected at key resistance levels like $0.25 could trigger panic selling as traders realize the upside momentum isn’t there yet.
Keep your eyes on volume spikes, watch for moving average crossovers on the 20, 50, and 200-day timeframes, monitor RSI for extreme readings, and stay alert for news about new exchange listings or major community events. This token moves fast, and the technical picture can shift dramatically in a matter of days.