Recent Developments & Market Sentiment
Gigachad ($GIGA) has carved out an interesting spot in the memecoin world on Solana—it’s got internet culture vibes, fitness branding, and a pretty dedicated community behind it. Lately, we’ve seen retail traders getting interested again, though things haven’t been easy with Bitcoin hogging attention and the general altcoin market feeling pretty lukewarm, especially for smaller tokens. What makes GIGA stand out is its identity—there’s actual real-world stuff going on with “Giga Fitness,” some celebrity shoutouts from names like Ernest Khalimov and Mike O’Hearn, plus solid branding throughout Solana’s meme scene. That said, there’s still plenty of risk around whether they can actually pull everything off.
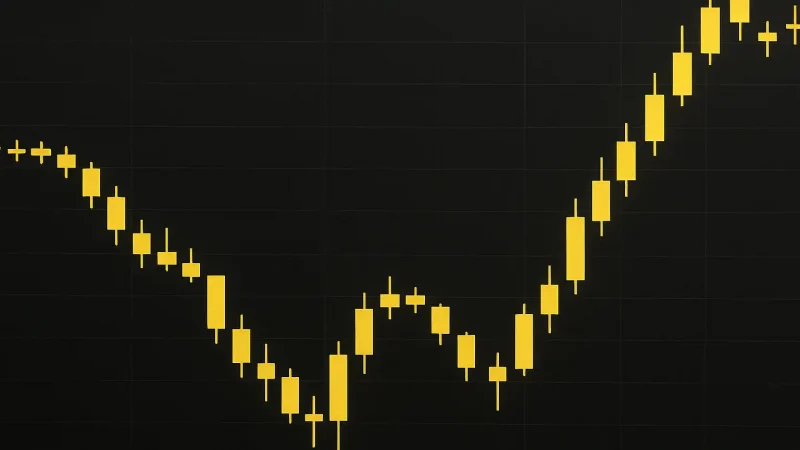
Looking at where things are now, it’s been a wild ride. Gigachad is trading way below its peak of around $0.095 from January 2025—we’re talking over 90% down from those highs. Daily trading volume bounces around between $2 million and $6 million, and market cap sits somewhere in the $35–$50 million range. What this tells us is that liquidity is pretty thin, meaning big trades or sudden mood swings in the market can really move the price around.
Technical Indicators & Price Structure
Support and Resistance Zones
From a technical standpoint, there’s important support hanging around $0.00350–$0.00365—that area has caught the price a few times during pullbacks. On the flip side, resistance shows up at about $0.00406 in the short term, then there’s a tougher zone between $0.00428–$0.00462. If we get some real momentum going, the next major hurdle would be up around $0.00500 and beyond. These levels come from looking at recent price swings and using Fibonacci retracements from the cycle top down to where we are now.
Momentum & Moving Averages
The momentum indicators are sitting in neutral territory—RSI is around 43-45, which means it’s not oversold enough to signal a bounce, but not overbought either. The moving averages paint a more bearish picture on longer timeframes: the 20- to 50-day averages are above the current price, basically acting as overhead resistance. Shorter-term averages like the 7-day and 10-day are a bit friendlier but still under pressure. Overall, the technical trend leans toward “sell” across multiple timeframes until we can break back above some of these key levels.
Price Prediction Scenarios
With the current price sitting around $0.00483, here’s what could realistically play out depending on which way the wind blows:
Bullish scenario: If GIGA can stay above $0.00385 and start closing daily candles above that $0.00428–$0.00462 resistance zone, we could see a push toward $0.00500. Getting past $0.00550 would need the broader altcoin market to heat up, some fresh social media buzz, and trading volume consistently above $5 million daily.
Bearish scenario: If that $0.00385 level breaks down, we’re probably heading toward the $0.00350 support area. Breaking below that could open the door to $0.00320 or lower, especially if the overall market turns risk-off. With thin liquidity, stop-losses getting hit and panic selling could make things drop faster than expected.
Base-case (sideways consolidation): Most likely, GIGA just chops around between $0.00380 and $0.00460 for the next couple to four weeks. Traders will keep testing support and resistance with modest volume. Without some kind of catalyst—new exchange listing, actual utility dropping, or the meme going viral again—we probably won’t see a breakout either way.
Longer-Term Outlook
Looking further out, if the team can fix some of the current weak spots—bringing in better liquidity, launching real utility with the fitness line and NFT marketplace, and keeping celebrities and influencers engaged—GIGA might work its way back up to the $0.007–$0.010 range over the next 6–12 months. But getting anywhere near those levels really depends on the bigger altcoin cycle turning favorable, getting some regulatory clarity, and most importantly, actually executing on the roadmap.
Bottom line for anyone trading or holding GIGA: keep your eyes on those critical levels around $0.00385 (the pivot point) and $0.00350 (support). Above $0.00450, you’re running into serious resistance. The trend signals are mixed to bearish right now, but the community strength and the story they’re building give it a shot if market sentiment turns around.