Current Price Action & Market Context
FLOKI/USDT is currently sitting at around $0.00005656, down roughly 1.61% in the last 24 hours. It’s not a dramatic drop, but there’s definitely some bearish pressure weighing on the price. That said, the technical picture hints that we might be approaching a bottom. What’s interesting is that FLOKI has been evolving beyond its meme coin roots—the team’s been pushing hard on their Valhalla metaverse, launching European ETPs for institutional access, and rolling out new utilities through FlokiFi. Sure, there’s been some bad news like getting delisted from BitMart, but the overall narrative is shifting toward actual utility and use cases rather than just hype-driven volatility. This could provide some real support going forward.
Key Technical Indicators and Levels
Looking at the 4-hour chart, the RSI is hovering around 57.8—moderately bullish territory, which is a decent sign. However, the MACD just crossed below its signal line and the histogram’s gone negative, so we’re not completely out of the woods yet in terms of bearish momentum. The good news? Price is still trading above both the simple and exponential moving averages at about $0.00005365, meaning short-term support is holding for now.
On the daily timeframe, things get a bit messier. The 5-day moving average is flashing a buy signal, but the 50-day and 20-day are acting as resistance—not exactly encouraging. Oscillators like STOCH and Williams %R are deep in oversold territory, pointing to either consolidation or a further pullback. The ADX shows some trend strength building, though it’s still relatively weak overall.
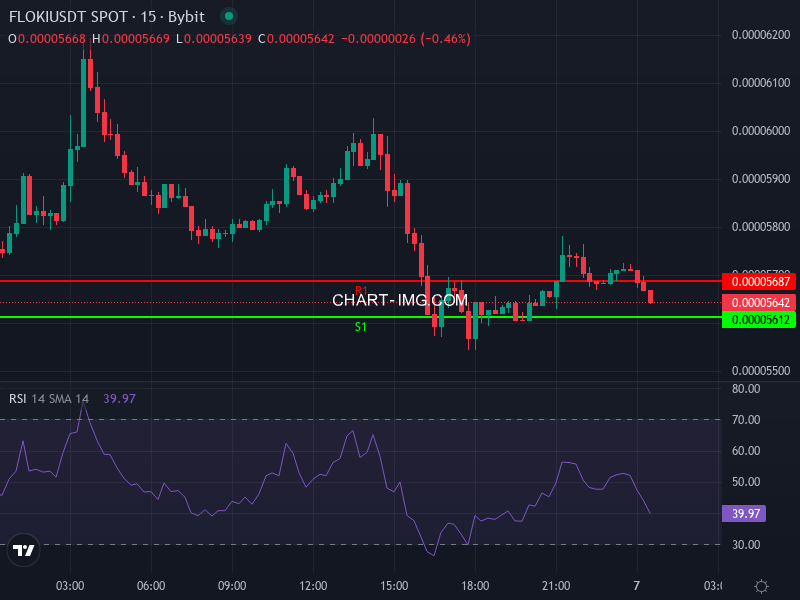
Here are the key levels to watch:
- Support zones: around 0.00005586–0.00005537 (these are your daily S2–S3 pivot points)
- Resistance ahead: roughly 0.00005736–0.00005762 (daily R2–R3 pivot area)
These levels will probably define the trading range in the near term unless we see a strong volume-backed breakout.
Price Prediction Scenarios: Where Might FLOKI Move?
Bullish Case: Upside Potential
If FLOKI can hold support between $0.0000555 and $0.0000559 and then push through that resistance zone around $0.0000573–$0.0000576 with solid volume, we could see a decent recovery over the next week or two. Realistic short-term targets would be somewhere around $0.0000558 to $0.00006. Now, if we get more aggressive and assume the ecosystem developments really start gaining traction—think Valhalla gaining users, burn mechanisms kicking in, and sustained buying pressure—there’s an outside chance FLOKI could test the $0.00010–$0.00012 range. That’s a big “if” though, requiring multiple resistance breaks and a major shift in market sentiment.
Bearish Case: Risks and Downside Support
On the flip side, if price can’t stay above that $0.0000555 support or drops below the 4-hour moving average, the bears might take control. The negative MACD and oversold stochastics could drive things lower. Next major support sits around $0.0000480–$0.0000500 based on analyst estimates and lower timeframe moving averages. Break below that, and we’re looking at a potentially deeper correction toward $0.000043–$0.000045, which would signal an extended bearish phase.
Judgment & Trading Strategy
Bottom line: FLOKI’s at a crossroads right now. The 4-hour timeframe looks neutral to slightly bullish, but the daily chart is throwing mixed signals with a bearish tilt. If you’re thinking about going long, wait for a clean breakout above that pivot resistance with volume confirmation, or at least a solid hold of the $0.0000555 support level. Risk management is key here—consider setting stops below $0.0000550 or $0.00005 depending on how much heat you can handle. For swing traders with a longer horizon, keep an eye on fundamentals like Valhalla adoption rates, token burn metrics from their locker mechanism, and institutional money flow. These factors will determine whether FLOKI can make a real run toward $0.00010–$0.00012 or higher.
Intermediate Outlook
Looking several weeks to a couple months out, there’s definitely potential for a move toward $0.00010 and beyond—but it’s not guaranteed by any means. FLOKI needs to stay above those key support levels, break through its medium-term moving averages, and catch some favorable broader market momentum. If any of those pieces don’t fall into place, there’s real risk of sliding back toward the $0.000045–$0.000048 zone, especially if the overall crypto market turns sour.