Recent News and Market Context
FLOKI (FLOKI/USDT) is currently hovering around $0.00003433, down roughly 4% over the past 24 hours. If you’ve been following the recent chatter, you’ll notice a lot of talk about oversold conditions mixed with ongoing bearish pressure showing up in the technical indicators. One report caught my attention—it mentioned the RSI sitting near 28, which is pretty deep into oversold territory. That’s led some analysts to think FLOKI might bounce back toward $0.000040 soon. Other forecasts are eyeing a potential climb back to previous resistance levels if the momentum starts swinging the other way. The common threads you’ll see everywhere right now? Oversold vibes, technical resistance hurdles, and people wondering where the recovery might land.
Technical Indicator Breakdown and Price Targets
Let’s dig into what the latest chart data and on-chain metrics are actually telling us about FLOKI:
- 4-Hour RSI: Sitting at about 38.5 right now. It’s crawled up from deeper oversold levels but still hasn’t made it past 50. This hints that we might see some recovery action, though it’s not exactly showing powerhouse strength yet. Since oversold typically means below 30, FLOKI could be in the early innings of a potential bounce.
- 4-Hour MACD: The MACD line is sitting just under the signal line, with a tiny positive histogram starting to show. What this tells me is that the bearish momentum is losing steam, and we could see a bullish crossover coming up if buyers start stepping in.
- 4-Hour Moving Averages: The SMA is hanging around $0.000036087 and the EMA at roughly $0.000036300. FLOKI’s current price is below both of these, meaning they’re now acting as resistance. If the price can push above these levels, that’d be a good sign for short-term momentum.
- Daily Pivot Points: Support (S1) is sitting near $0.00003347, with resistance (R1) around $0.00003553. The pivot point itself is at $0.00003483. Whether FLOKI drops further or not really depends on holding these support levels, while the path up faces some pretty stiff resistance all the way to R2 at about $0.00003689.
- Rate of Change (Daily): This one’s showing a pretty ugly negative number, pointing to a sharp drop over recent days. But here’s the thing—when you combine a deep negative ROC with an oversold RSI, it can set the stage for a bounce back if the overall mood in the market shifts.
Based on what these indicators are showing, here’s what I’m thinking could happen with FLOKI’s price across different timeframes, along with the key levels worth watching:
Short-Term (1 Week)
If FLOKI can hold support above roughly $0.0000335–$0.0000340 and we start seeing the RSI creep upward, I’d be watching for a bounce toward resistance in the $0.0000355–$0.0000365 area. Getting above that SMA/EMA zone (around $0.0000361-$0.0000363) would be a solid confirmation that momentum is starting to shift back in favor of the bulls. On the flip side, if that support level breaks, we could easily see FLOKI slide down to $0.0000325–$0.0000330.
Medium-Term (4-6 Weeks)
Assuming the bounce actually holds and the overall meme-coin sentiment picks up, FLOKI could realistically push toward $0.000045–$0.000060. This lines up with what other analysts have been saying based on those oversold RSI readings—many are targeting that $0.000050-$0.000060 zone as a recovery area. For this to actually play out though, we’d need to see the MACD cross into bullish territory and volume start picking up, confirming a real breakout above those resistance clusters. But if support can’t hold and the negative momentum continues, we might be looking at a drop toward $0.000025–$0.000030 instead.
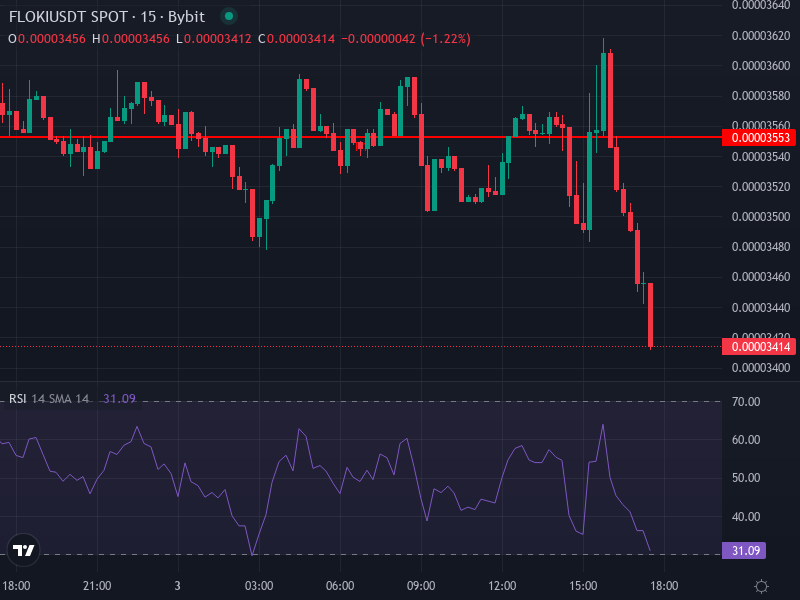
Applying the Latest Chart Graphic
The chart below shows recent intraday movement for FLOKI/USDT and highlights those key zones we’ve been talking about—support around $0.0000335, resistance near $0.0000363, and the current consolidation happening below that zone.
Risks, Confirmation Levels, and Strategy Suggestions
FLOKI is notoriously volatile and extremely sensitive to market sentiment, so there are definitely some risk factors and confirmation points you should keep an eye on before making any trading decisions:
- Critical Support Zones: The $0.0000330–$0.0000335 range is absolutely crucial. If we see a sustained break below this area, most of the bullish scenarios go out the window.
- Resistance Barriers: We need to see FLOKI clear the SMA/EMA zone (~$0.0000361-$0.0000363), the daily resistance around $0.0000355-$0.0000370, and eventually R2 (~$0.0000369) for any real upside momentum to take hold.
- Indicator Confirmation: Keep watching for the MACD line to cross above the signal line with the histogram bars growing bigger, RSI climbing above 50, and volume starting to increase. When you see all these signals together, that’s when you know momentum is actually shifting bullish.
- Sentiment and Sector Strength: Don’t forget that meme coin sector rotation, any news about FLOKI’s utility development (like their metaverse and gaming projects), and broader macro factors like crypto regulations or Bitcoin dominance shifts will all play a huge role in FLOKI’s performance.
Strategy-wise, if you’ve got a higher risk tolerance, you might consider building a position near current levels with tight stop-losses set below support. But if you’re more conservative, it probably makes sense to wait for clear technical confirmation—like a convincing break above resistance backed by solid volume—before jumping in.
Bottom line: FLOKI is definitely feeling the bearish pressure right now, but those oversold conditions and weakening bearish momentum have opened up a window for recovery. If key resistance gets broken, we could realistically see a move toward $0.000050-$0.000060 over the next few weeks. But if support gives way, the downside risk is still very real. Whatever you decide, make sure you’re prioritizing risk management and waiting for confirmation rather than just speculating.