Recent Context & On-Chain Sentiment
Dogwifhat (WIF) has been catching plenty of attention lately as a meme coin that’s all about volatility and riding the wave of market sentiment. There hasn’t been much in the way of major news, but what’s interesting is that on-chain data shows whales have been scooping up significant amounts of WIF throughout mid-2025. That suggests some big players believe in the current support levels. The whole meme-coin space on Solana is kind of in rotation mode right now, with BONK and similar tokens pulling trader interest in different directions.
From a tech standpoint, WIF runs on Solana, which means it benefits from Proof-of-History and those super low fees that make transactions lightning fast and cheap. That’s a solid foundation for a meme coin, though let’s be honest—it doesn’t really have much utility beyond the social hype machine. And regulators are starting to pay more attention to meme coins across the board, which adds another layer of risk to consider if you’re thinking about jumping in.
Technical Snapshot & Short-Term Momentum
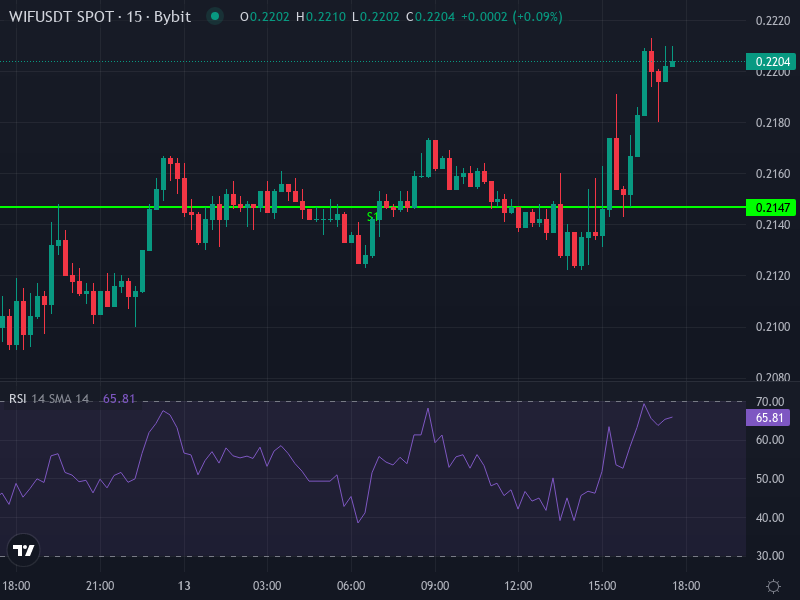
Looking at where things stand right now, WIF/USDT is trading around 0.22042, up roughly +4.79% over the last 24 hours. If we zoom into the 4-hour charts, here’s what we’re seeing:
- RSI is sitting at about 56—showing some bullish momentum without being overheated yet.
- MACD is showing a slightly positive histogram with the MACD line sitting above the signal line, which hints at emerging bullish momentum. The EMA (around 0.2180) and SMA (around 0.2169) are both hovering just below current price, offering nearby support cushions.
Daily pivot points tell us the main pivot is at roughly 0.21833. First resistance sits at R1 around 0.22467, then R2 at 0.22833, and R3 up at 0.23467. On the flip side, support levels come in at S1 around 0.21467, S2 at 0.20833, and S3 down at 0.20467. These levels are probably going to define the battlefield for short-term price action if volatility stays steady.
Major Levels & Pattern Probabilities
Resistance Zones & Downside Risk
Looking upward, there’s a cluster of resistance hanging out between roughly 0.225–0.235. If price can punch through R1 (around 0.2247), the next natural target would be R2 (around 0.2283), followed by R3 (around 0.2347). But once we get above 0.235, things might get trickier—there’s psychological resistance there plus some congestion from previous moving averages and the broader meme-coin resistance band.
Support Near Key Pivots
On the downside, the first real test is around 0.2147 at S1. If that level gives way, we’d be looking at S2 (around 0.2083) and then S3 (around 0.2047) as potential landing zones. Given how oversold some of the daily indicators are looking, those lower support levels might actually attract some buyers looking for a bounce.
Long-Term Trend & Larger Picture
When you step back and look at the bigger picture beyond just intraday and daily moves, WIF’s momentum is honestly tilting negative. Daily RSI is hovering near or below 30 in most technical scans, which screams oversold territory. The MACD and various moving averages—whether you’re looking at the 50-day, 100-day, or even 200-day—are all sitting well above where price is now, which tells us that a genuine trend reversal hasn’t happened yet.
The support zone around 0.20–0.21 is really important from a long-term perspective. If we break cleanly below that range, the door opens to testing somewhere around 0.18–0.19. For the bulls to really take control again, we’d need to see price reclaim and hold above roughly 0.24—preferably on strong volume—which would open up possibilities for higher resistance around 0.28 or beyond.
Price Prediction Scenarios
- Bearish scenario: If the weakness continues, price slips through S1 (around 0.2147) and heads toward S2 (around 0.2083). Breaking that support could accelerate things down to S3 (around 0.2047) and potentially that broader structural support zone around 0.18–0.19. We’re talking about a potential 15-20% drop from current levels in this scenario.
- Base case / consolidation: WIF manages to hold above S1 and basically trades sideways between roughly 0.2147-0.235 for the next several days or weeks, with small ups and downs. The big question is whether resistance at R1 and R2 breaks with decent volume, or if we just keep bouncing around in this range.
- Bullish reversal: A clean breakout above 0.235 backed by solid volume could set up targets around 0.26-0.28. If momentum really builds and we clear that zone, we might see further upside toward 0.30-0.32, though that would need sustained buying pressure and some favorable winds for meme coins overall.
Indicators to Watch Closely
Here are some key signals that could tip the scales one way or another:
- MACD crossing back above the signal line with a growing positive histogram.
- RSI climbing above 50 while volume picks up noticeably.
- Price breaking and holding above the EMA20/EMA50 on the daily timeframe, which would signal a trend shift.
- Pivot action: staying above 0.2183 and successfully breaking through those resistance layers.
Final Insight
Dogwifhat is sitting at a pretty interesting crossroads right now. While the short-term charts are showing some cautiously bullish signs, the broader trend is still shaky until we see key resistance levels get broken and support zones defended with conviction. If you’re holding around this 0.22 level, the risk-reward really only starts looking attractive with stronger volume and clear breakout patterns. Without those confirmations, there’s a real chance we could drift back down toward 0.20 or lower. Anyone playing this should size positions carefully and keep a close eye on the indicators that could shift things from correction mode into recovery territory.