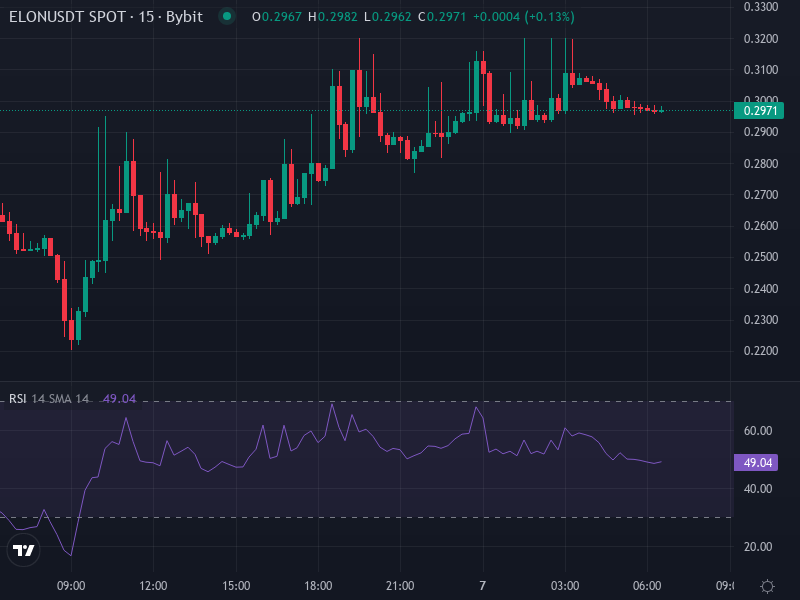
Current Landscape & Key Indicators
ELON is currently trading at around 0.00000003467340049424977 USDT, showing a solid 24-hour jump of roughly 12.49%. The market feels pretty volatile right now, sitting in that uncertain space between a potential oversold recovery and continued downward momentum. When you look at the major moving averages—the 20, 50, 100, and 200-period EMAs and SMA—they’re all sitting well above where we’re trading now, which tells us the overall trend has been bearish across both weekly and daily charts. That said, the daily RSI is hanging around oversold territory, hinting that sellers might be running out of steam unless something else negative pops up.
Looking at the Bollinger Bands, ELON’s been hugging or bumping against the lower band lately. That’s usually a sign we could see a short-term bounce if buyers step back in with some decent volume. The ATR readings show volatility is still running high, meaning we’re seeing some pretty wild percentage swings. As for the MACD, it’s been pretty neutral recently—not really giving us much to work with in terms of confirming any major trend reversal.
Support, Resistance & Pattern Dynamics
There’s immediate support sitting around 0.0000000352 USDT, which lines up nicely with that lower Bollinger band. If things get more bearish and that level doesn’t hold, we’re looking at deeper support zones closer to 0.00000003-0.000000032 USDT. On the flip side, ELON needs to push past 0.00000005004 USDT to start making any real progress—this level has been tested multiple times but hasn’t been convincingly broken yet. Beyond that, you’ve got stronger resistance forming around 0.00000005850 to 0.00000006200 USDT, areas that line up with several moving averages and previous price peaks.
There’s also this descending trendline that keeps capping any upward moves, really reinforcing that bearish structure we’ve been seeing. What’s concerning is that volume has been pretty weak during recent rally attempts, suggesting these resistance zones might hold firm unless we get a strong catalyst or see renewed demand come flooding in.
Patterns & Sentiment Influences
Some analysts have been talking about a potential ascending triangle pattern from earlier months, formed by flat resistance near $0.00000050 USDT and those rising lows. Unfortunately, this pattern hasn’t delivered a breakout yet. When you dig into the on-chain data, it looks like long-term holders are slowly accumulating, and the community stays pretty engaged—which is typical for these meme-driven coins. But here’s the thing: a huge chunk of ELON’s massive total supply was added to circulation fairly recently, which waters down any scarcity narrative and really changes what realistic upside targets might look like.
Price Forecast & Scenarios
Based on what the technicals are telling us right now, here’s how things could potentially play out for ELON in the near to medium term:
- Bullish case: If ELON manages to break cleanly above that 0.000000050 USDT resistance with solid volume backing it, we could realistically test the mid-resistance area around 0.00000005850-0.00000006200 USDT. If that momentum really sustains itself, there’s an outside chance of pushing toward 0.0000001 USDT—though that would need widespread positive sentiment, favorable market conditions overall, and a real reduction in selling pressure.
- Neutral scenario: More likely, the price just consolidates between support at 0.00000003-0.000000035 USDT and resistance near 0.00000005 USDT. The oscillators might bounce off those oversold levels, and we’d probably see some choppy, sideways trading until something significant shifts the momentum one way or another.
- Bearish outcome: If that lower support zone breaks down, ELON could easily slide toward 0.00000002-0.000000025 USDT. Oversold conditions, broader market volatility, or any negative news regarding supply issues could really accelerate those losses. If you’re thinking about entering around these levels, definitely use careful risk management.
Outlook: What Investors Should Watch
There are several key things you’ll want to keep an eye on to figure out whether we might see a trend reversal:
- Volume surges: Any breakout attempt without real volume behind it probably won’t stick. We need to see increased buying volume across exchanges or some serious whale accumulation to really tip things in favor of the bulls.
- Moving average alignment: Those key resistance zones tied to the 50, 100, and 200-period EMAs need to be cleared. These could act as pretty serious sell walls in the near term.
- Supply news: Any updates about circulating supply or how tokens are being distributed could shift price targets really quickly. Previous supply additions have already forced investors to recalibrate their expectations considerably.
- Macro crypto sentiment: ELON is pretty sensitive to broader altcoin movements, regulatory developments, and overall appetite for meme tokens. Whether the wider market catches tailwinds or headwinds in these areas could be absolutely decisive.
Prediction Summary
Looking at where we are right now, ELON’s technical setup feels pretty fragile. Without some strong positive catalysts coming into play, the most realistic path forward is probably consolidation between 0.00000003-0.00000005 USDT. A clean breakout above 0.000000050 USDT would open up a potentially bullish path toward 0.000000062 USDT. On the other hand, if that support near 0.00000003 USDT gives way, we could realistically see downside toward 0.000000020-0.000000025 USDT.