Current Market Snapshot and Catalysts
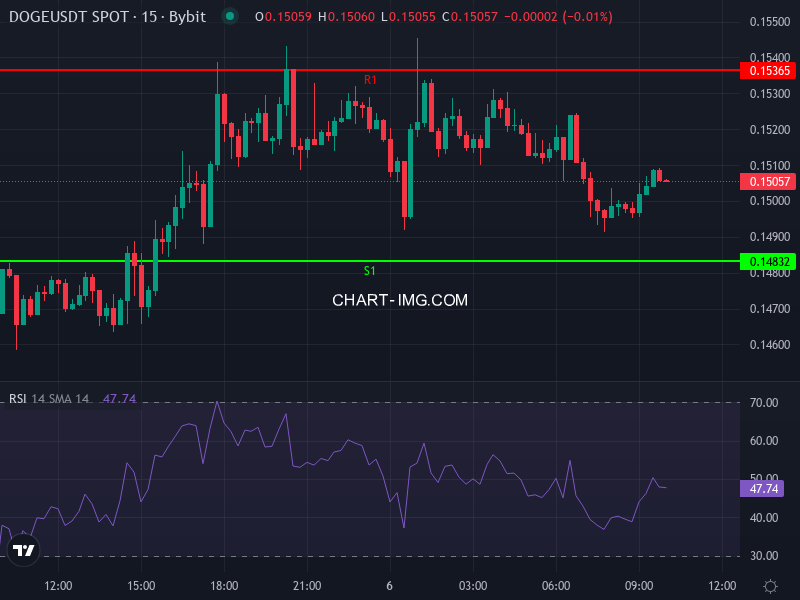
Dogecoin is currently sitting around $0.1520 USDT, up a modest 0.94% in the last 24 hours. The recent bump comes from a wave of optimism washing over the broader crypto market, where risk-on sentiment has given a lift to meme coins and major assets alike. One report highlighted Dogecoin surging more than 10%, making it one of the standout performers among the top-10 cryptocurrencies by market cap. This momentum seems to be fueled by a mix of favorable macroeconomic narratives and crypto-specific catalysts. Things like interest rate expectations, inflation trends, and regulatory developments appear to be playing into this upside move, particularly as investors hunt for returns outside traditional markets. (as of early January 2026)
That being said, the positioning is still pretty mixed. Some analysts are pointing toward potential short- to medium-term gains if DOGE can punch through certain resistance zones. Others are more cautious, noting that the structural weakness visible in long-term moving averages and trend patterns might cap any aggressive rallies unless the broader crypto sector keeps its strength going.
Technical Indicator Analysis
Looking at the 4-hour chart, we’re seeing some encouraging signals. The RSI is hovering around 63.3, which tells us there’s bullish momentum building without things getting overheated just yet. The MACD line is sitting slightly below the signal line with a negative histogram value of roughly -0.00071, showing there’s still some subtle bearish pressure lurking. Meanwhile, the short-term moving averages are sitting well below the current price—the SMA is near $0.1431 and the EMA around $0.1438. These could act as support zones if we see a pullback.
When we zoom out to the daily pivot analysis, things get clearer. The first resistance level sits at approximately $0.1536, with stronger barriers at $0.1567 and $0.1590. On the flip side, support levels are stacked near $0.1483, $0.1461, and $0.1430. Right now, with price hovering close to the $0.1514 pivot, a break above $0.1536 could really get the ball rolling on the upside. But if we can’t hold above $0.1483, we might be looking at a deeper pullback.
Momentum and Trend Considerations
Volume is going to be crucial here in confirming any breakout. History shows that Dogecoin’s significant upswings have typically come alongside major whale accumulation or big surges in trading volume. Without that kind of fuel, price advances tend to be shallow and quick to reverse. Meanwhile, the bigger picture trend—represented by the longer-term moving averages like the 50- and 200-period EMAs—remains bearish. This means any upside we’re seeing right now is more likely a corrective rally unless something shifts in those higher timeframe structures.
Price Scenarios: Paths Forward and Key Levels
Looking at how the current indicators line up with historical patterns, we’re basically looking at two main scenarios for DOGE in the near to medium term:
- Bullish Scenario: If DOGE can convincingly break through resistance at around $0.1536 and actually hold above it, the next targets are sitting at $0.1567, followed by the $0.1589–$0.1600 range. Momentum would probably pick up steam if volume comes in strong, potentially confirming a break above that descending channel we’ve been seeing lately. A sustained push past these levels could send DOGE toward the $0.18 mark, especially if the broader crypto market stays strong.
- Bearish Scenario: On the other hand, if price can’t crack that resistance and starts rolling over, the first support is sitting near $0.1483. Breaking below that would expose the stronger support around $0.1461 and $0.1430. If we break through these zones, it could reignite bearish pressure and potentially drag DOGE down toward $0.12 or lower—particularly if we get hit with macroeconomic headwinds or regulatory concerns.
Final Insight: Watch Resistance, volume & macro closely
Dogecoin is basically sitting on a knife’s edge right now between a corrective bounce and a continuation of its longer-term downtrend. The technicals are showing some real opportunity here—but only if those resistance levels get taken out convincingly and trading volume backs up a genuine breakout. If resistance holds firm and momentum fizzles out, we’re probably looking at a deeper retracement. Bottom line for traders and investors: what happens around that $0.1536–$0.1580 zone is going to tell us whether Dogecoin is just bouncing around or actually starting something more meaningful.