Recent News and Market Context
Dogecoin has been catching some attention lately, with noticeable increases in both trading volume and derivatives activity over recent weeks. This tells us that both institutional players and everyday retail traders are getting back into DOGE, even though there haven’t been any major protocol updates or fundamental changes to speak of. The rallies and breakout attempts we’re seeing seem to be driven more by overall market momentum than anything specific to Dogecoin itself.
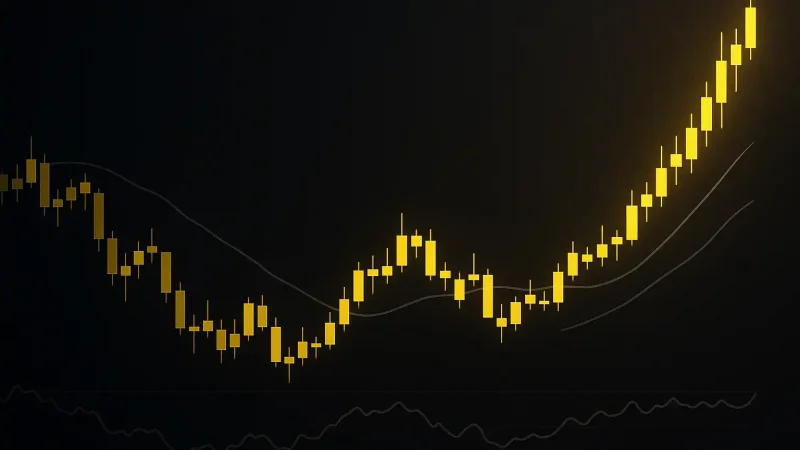
One interesting development is that DOGE has formed what’s called a golden cross on the weekly chart—basically, this happens when shorter-term moving averages climb above longer-term ones, and it’s generally considered a bullish sign. Historically, when Dogecoin has formed this pattern, it’s often been followed by upward price trends, though of course that depends on whether the momentum can actually stick around. We’ve also seen support holding pretty well around the psychologically important $0.10 level, which might mean a solid floor is building. Traders are now watching resistance zones around $0.12 to $0.15 as the next major hurdles if current support continues to hold.
Technical Indicators and Price Structure
Right now, DOGE is trading at about $0.09207, which puts it just below its 4-hour simple moving average of roughly $0.09303, and also slightly under its 4-hour exponential moving average at around $0.09245. What this tells us is that on shorter timeframes, DOGE is in a mild downtrend, though it’s not dramatically so since the price is still pretty close to these moving averages.
The 4-hour RSI is sitting at approximately 48.61, which is right in neutral territory—it’s not oversold (which would be below 30) and it’s not overbought (which would be above 70). This neutral reading suggests the momentum is fairly balanced right now, and DOGE might just be waiting for something to push it one way or the other. The MACD on the 4-hour chart backs this up: the MACD line is sitting slightly above its signal line with a small positive histogram of about +0.00019, which hints at a mild bullish lean. However, since the MACD values themselves are still negative, it shows that the underlying downward pressure hasn’t been completely overcome yet.
Support and Resistance Levels (Daily Pivot Points)
Understanding the key daily pivot points is really important for figuring out where the price might head in the near term. The resistance levels to watch are:
- R1 ≈ $0.09502
- R2 ≈ $0.09799
- R3 ≈ $0.10066
And on the support side, we have:
- S1 ≈ $0.08938
- S2 ≈ $0.08671
- S3 ≈ $0.08374
The central pivot point is hanging around $0.09235. Since price has been trading below that level, it’s likely to act as resistance now, while the $0.089 to $0.090 range is currently acting as short-term support. If we see a break below S1, that could speed up a move down toward S2. On the flip side, if price manages to push above R1 toward R2, that could signal a genuine reversal attempt is underway.
Short-Term and Medium-Term Price Predictions
Looking at what the indicators are telling us and how the market is set up right now, there are a few different scenarios that could play out for DOGE over the next days and weeks:
- Bullish Recovery Scenario: If DOGE can manage to close above both the SMA and EMA on the 4-hour chart (around $0.0935), and then push through the pivot near $0.0950 (R1), we could see it targeting the $0.0980 to $0.1007 range (R2–R3). If volume picks up and it breaks above that zone, we might even see a more aggressive move toward $0.12.
- Range-Bound Consolidation: Given that the RSI is neutral and the MACD histogram is only weakly positive, there’s a decent chance DOGE just stays stuck between roughly $0.0895 and $0.095 for a while. In this scenario, we’d see price bouncing around above and below the moving averages without much clear direction—not great for trend followers, but it could offer some opportunities for range traders.
- Bearish Risk Scenario: If support at $0.0894 (S1) gives way, we could see a deeper drop toward $0.0867 (S2), and possibly even down to $0.0837 (S3) if broader market conditions turn negative or if there’s a general risk-off mood. Warning signs for this scenario would be a downward MACD crossover or the RSI dropping below 40.
Implications for Traders and Investors
For active traders, the critical zone to watch is between $0.0925 and $0.0950. A clean break above that range would be a pretty clear bullish signal, while failure to break through could mean we’re headed back down to test support or continue lower. If you’re day-trading, you might want to use tighter levels—support around $0.090 and resistance near $0.095—to work with intra-day price swings.
If you’re investing with a longer time horizon, the big questions are whether that golden cross will actually hold up and whether the structural support around $0.10 is really as solid as it looks. If both of those things prove true, DOGE could be setting up for a run toward $0.15 or even higher as sentiment improves and volume increases. But if support breaks down, there’s still meaningful downside risk, so it’s important to manage your position sizes and risk accordingly.