
Market Context and Recent Developments
Right now, BRETT (Based) is sitting at around $0.01774 USDT, showing a small daily bump of roughly +0.63%. The token’s market cap hovers near $177.8 million USD, with about 9.91 billion tokens in circulation out of a maximum 10 billion supply. These numbers tell us BRETT is still a smaller player in the crypto space, which means we can expect plenty of price swings and serious upside potential if it manages to break through important price levels.
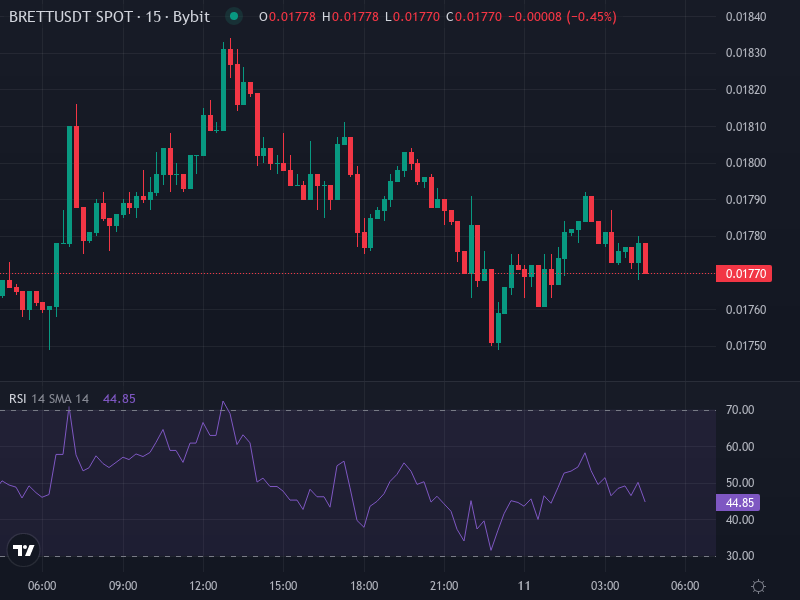
Looking at recent technical analysis, BRETT is flashing a “Strong Buy” signal across most major indicators and moving averages. Everything from the 5-day to the 200-day moving averages is lining up in a bullish pattern, while momentum indicators like MACD, CCI, and Williams %R are all pointing upward. That said, there are some warning signs popping up—stochastic indicators are showing overbought conditions, and the RSI is creeping into the upper ranges.
Key Technical Indicators and Price Zones
Let’s break down what the charts are telling us:
- Relative Strength Index (RSI 14): Currently hanging out in the mid-to-upper range, which means momentum is healthy but getting close to overbought territory.
- Stochastic and StochRSI: Both of these are flashing overbought readings, suggesting we might see some pullback unless buyers keep pushing hard.
- ADX (Trend Strength): Running pretty high, which confirms there’s already a solid trend happening. This means any breakout could be pretty significant.
- Support / Resistance Levels (BRETT/USDT pair): The important support zone sits between $0.0160 and $0.0186. On the upside, we’re looking at resistance walls at $0.0211, $0.0225, and $0.0236. Breaking through these levels could open the door for some real gains.
Price Projection Scenarios and Risk Overview
Bull Case: Breakout toward Resistance Cluster
If the bulls keep running, and BRETT manages to stay above that $0.0186 support while pushing past the first resistance around $0.0211, we could easily see a climb toward $0.0225 and then $0.0236. With the right market sentiment and trading volume, there’s even potential for a run to $0.024-$0.025, with those moving averages acting as safety nets along the way. For this scenario to play out, watch for MACD crossovers, continued strength in ADX, and clean breaks above resistance with solid volume backing it up.
Bear Case: Pullback toward Key Support
Here’s the thing though—those overbought signals from stochastic and RSI are red flags we can’t ignore. If selling pressure picks up, the most vulnerable spots are between $0.0174 and $0.0160. If price drops below $0.0160, we could be looking at a slide down to the $0.0140-$0.0150 range. Keep an eye on a weakening ADX, bearish divergence in MACD or Williams %R, or failed attempts to reclaim resistance levels. The good news is that oversold readings might trigger some bounce action around $0.0150 if things get choppy.
Risk Factors: BRETT is super sensitive to what happens on the Base chain, news about exchange listings, and any regulatory developments. Since almost all of the token supply is already out there, growth really depends on fresh demand coming in rather than new tokens being created. Plus, being tied to meme culture means sentiment can turn on a dime, and when it does, prices can tank fast.
Estimated Price Levels over Short-to-Medium Term
Over the next few weeks, expect BRETT to bounce around between $0.0165 and $0.0215 unless something major happens. Looking at the next 1-3 months, if the bulls stay in control, a push toward $0.0235 to $0.0250 is definitely on the table with favorable market conditions. On the flip side, if things turn bearish or just go sideways, that support zone around $0.0150 to $0.0140 becomes crucial. Smart money would set stop-loss orders below $0.0160 to keep risk in check.